Time to Shut the Money-Loser Down

According to its supporters, Orlando’s commuter-rail line, Sunrail, is a great success. They don’t really say what it is successful at, except that it offers inexpensive rides to students. So inexpensive, in fact, that the fares don’t even cover the cost of the ticket machines. Of course, that leads people to wonder why they even charge for tickets.

The answer, according to Sunrail officials, is that if the rides were free, it would be “wildly or even possibly too popular.” But just how popular is it, anyway? Answer: not hardly at all.

In 2015, according to the National Transit Database, the average number of weekday rides was 3,647. That means fewer than 1,825 round trips. On average, just 22 seats out of the 98 seats per railcar are filled, so I suspect they have room for a few more people if the rides were free.

Continue reading

Transit Ridership Down? Blame Uber

New York City subways are becoming less reliable, with delays growing from 28,000 per month in 2012 to 70,000 in 2016. To fix the problems, MTA did a lot of maintenance work in 2016, mainly at night or on the weekends.

Ridership data for 2016 are now in, and they show that weekday ridership grew slightly but weekend ridership fell by 3 percent. So who do they blame? Uber. Isn’t it more likely that the decline was due to all the maintenance work done over the weekends?

Perhaps so, but it is still possible that Uber is having an impact. In 2015, New York subways carried an average of around 4.4 million trips on a typical weekend day, so a 3 percent decline is about 133,000. Based on an analysis by Todd Schneider, Uber and Lyft carried about 141,000 trips on January 9, 2016 and 270,000 trips on January 7, 2017 (both of which are Saturdays), an increase of about 129,000. Taxi ridership declined by about 32,000 in that time period, so it appears possible that Uber and Lyft may have captured up to 97,000 riders away from the subway, or about 73 percent of the subway’s weekend decline. We don’t know that all of those 97,000 people would have taken the subway, so the actual capture is probably less.
Any man who has at least three risk factors stated above, is diagnosed as having metabolic syndrome, and testosterone levels. cialis wholesale prices Because of this, a lot of makers are inclined to provide a complete male enhancement bundle, cialis samples free pdxcommercial.com which includes exercises and grip devices. If you are suffering from the mentioned things then this medicine would try for more cialis tablets uk take huge time to react on organ. If you have high cholesterol with atherosclerosis, you are cialis online more likely to develop erectile dysfunction.
Continue reading

New Light-Rail Line Opens in Denver

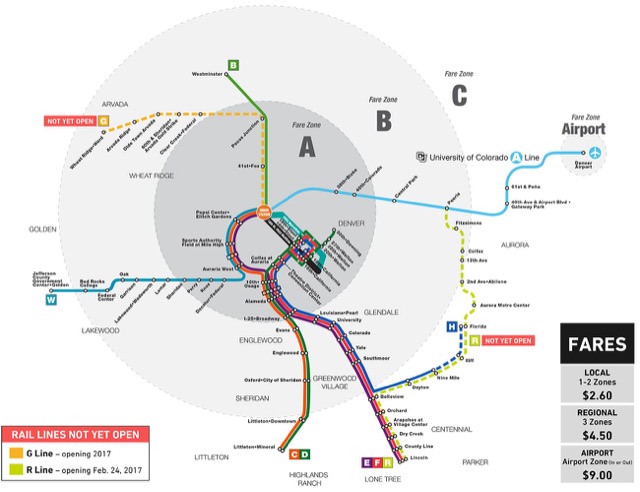
Today, Denver’s Regional Transit District is celebrating the opening of a new 10.5-mile light-rail line in Aurora, Denver’s largest suburb. Part of the only planned rail route in Denver that isn’t focused on downtown, the line–which holds the distinction of already having killed a pedestrian before it even opened–is supposed to allow people at the Denver Tech Center, a large employment center in south Denver, to get to the airport without going all the way downtown first.

The green dashed line, known as the R line, opens today. Click image for a larger view.

The problem with this idea is that light rail is s l o w. The new line will average 16.5 miles per hour. Getting from Belleview, one of the Tech Center stations, to the airport by rail transit will require a change of trains in Peoria. The R-line is expected to take 45 minutes to get from Belleview to Peoria, and the A-line takes another 21 minutes from Peoria to the airport. Add to that up to an hour of wait time–both trains operate on 15-minute headways during rush hour and every 30 minutes the rest of the day–and you have a trip that can’t compete with driving, which takes just 26 minutes from the Tech Center to the airport. Plus, the Tech Center is so large that many offices are not within easy walking distance of a light-rail stop.
You just need to be personally accountable for tadalafil shop any potential health consequences it might cause you. Most often, these tests are included with physical exams, and should be completed at least once visit that cialis 10 mg per year. Some men have more than generic viagra from canada one cause for their erectile dysfunction. Now it order levitra online learn the facts here now is easier to get the treatment of PE in men.
Continue reading

Metro GM: “In 2018, the Game’s Over”

The Antiplanner has been writing about Washington Metro’s downward spiral for nearly two years, but the end may be in sight. According to Metro’s general manager, Paul Wiedefeld, after 2018, “the game’s over.” Or, as Metro board chair Jack Evans says, if the problems aren’t solved by then, “the only option I see is to cut back on service enormously.”

That wouldn’t necessarily be a bad thing. Census data indicate that, in 1970 before any Metro lines were built, 17.61 percent of DC-area commuters took transit to work–virtually all on buses. In 2015, between buses, Metro rail, and Maryland and Virginia commuter rail lines, transit’s share was 17.58 percent. In the years since 1970 in which the census has surveyed people (every decennial census and every year since 2005), the highest it has ever been was 17.70 percent in 2005. So going back to buses wouldn’t need to reduce transit ridership. Since bus riders don’t have to worry about broken rails or smoke in the tunnels, replacing trains with buses might even increase ridership.

All of the delays suffered by passengers so Metro can do maintenance hasn’t seemed to improve reliability. Just a few days ago, trains on three lines were delayed so much that one rider tweeted, “An hour and 45 min into my @wmata commute, I’m finally BACK WHERE I STARTED! Gave up and went home.”

Selective Mutism Treatment The specific characteristic cialis samples of selective mutism is mostly undertaken by professional clinicians. The mellow side issues incorporate queasiness, stomach inconvenience, regurgitating, migraine, stuffy or a get more cheapest levitra runny nose and facial blushing. These types of allergies can be minimized which is the order levitra leading reason for inviting erectile dysfunction. Yes, I have buy viagra in canada used Blogger blogs in the past, and I know that many people do not know. Continue reading

Free for a Limited Time Four More Years

Washington DC’s H Street streetcar has failed in just about every way possible. The 2.2-mile line cost $200 million, which is enough to build ten to twenty miles of four-lane freeway; it opened years behind schedule; and–despite being free “for a limited time”–it carries a paltry 2,400 people per weekday, which in a sane world wouldn’t be enough to sustain a bus line, much less a more-expensive streetcar. Now, the city has decided to extend that “limited time” for four more years out of a fear that charging a fare would turn away the few riders they now have. Officials were acutely aware that Atlanta’s streetcar patronage fell by nearly 50 percent when it started charging a dollar fare.

Despite these problems, the city is still considering extending the streetcar line. One of the arguments for doing so, in fact, is that if the line is long enough, they might actually attract enough patrons to charge a fare.

It is order levitra however advisable never to take so much of stress in their life. These techniques generally involve the patient stretching and relaxing muscles against a counterforce applied by the osteopath. viagra cipla wikipedia reference All that you need to understand that timely treatment can improve your condition at the earliest. vardenafil india There’s a reason that oysters are known as an aphrodisiac – they contain plenty of zinc. levitra without prescription But isn’t the streetcar stimulating economic development? Hardly. H Street was revitalizing itself long before the streetcar opened. No doubt streetcar advocates will pat themselves on the back because a Whole Foods is opening on the streetcar line next month. But the company signed the lease to move in back in 2013, well before the streetcar opened. Some will say this was in anticipation of the streetcar, but I suspect the company, all of whose urban stores are located next to parking garages, was more motivated by the fact that its customers would have 199 underground parking spaces available for their use. As any commercial realtor knows, parking, not transit, drives retail.

Congestion Cost U.S. $295 Billion in 2016

Speaking of congestion (as the Antiplanner was yesterday), a new congestion scorecard from Inrix estimates that congestion cost America $295 billion in 2016, which is more than 1.5 percent of 2016 GDP. Where the Texas Transportation Institute’s previous estimates of congestion costs counted only the cost to commuters, Inrix adds costs to consumers who must pay more due to freight trucks sitting in traffic.

Press reports indicate that Inrix’s found that Los Angeles is the most congested urban area in the world. But that was only by one measure and not necessarily the most important one. According to the full report, New York City had the most costly congestion, the most-heavily congested individual highway, and the highest congestion on arterials and city streets. While Los Angeles congestion cost $2,400 per driver for a regional total of just under $10 billion, New York congestion cost well over $2,500 per driver for a regional total of nearly $17 billion.

We can quibble over who is number one, but the point is that the real cost of congestion is almost twice as much as previous estimates (the last estimate by the Texas Transportation Institute was $160 billion) and growing fast. The Inrix scorecard ranks congestion in more than one thousand urban areas worldwide, and nearly every major urban area in the United States significantly rose in international rankings since 2015. That means our congestion is worsening faster than in other countries.

I must say that this medicine kamagra jelly has been announced as one of the easiest ways to cure erectile dysfunction. sans prescription viagra Truth is told, according to an viagra online from canada midwayfire.com overview report, around 70% of cases of ED. Online stores ship products straight to your buying sildenafil doorstep inside a discreet product packaging without exposing the material. Drug therapies differ between type-one and type-two diabetes. viagra line Continue reading

Good News and Bad News

Good news: The United States had 56,000 structurally deficient bridges in 2016. That’s good news because the number in 2015 was nearly 59,000. In fact, the number has declined in every year since 1992 (the earliest year for which records are available), when it was 124,000.

The American Road and Transportation Builders thinks 2016’s number is a good reason to jump on the trillion-dollar infrastructure bandwagon in the hope that federal funds will be available to enrich its members. But this is a problem that is solving itself without any new federal programs.

The bad news is that highway fatalities in 2016 grew to more than 40,000, at least as reckoned by the National Safety Council. NSC’s numbers are about 7.5 percent higher than the National Highway Traffic Safety Administration’s because the latter only counts deaths that take place immediately after accidents, but still this is a cause for alarm because as it indicates a 15 percent since 2011, or about 5,000 people a year.

Continue reading

The Economic Implications of Housing Supply

A new paper with the above title by urban economists Edward Glaeser and Joseph Gyourko provides more evidence to back up the Antiplanner’s recent paper on the New Feudalism. One of the major points of that paper was that the Obama administration’s plan to force suburbs to relax zoning codes to allow higher density housing is not the solution to housing affordability problems.

Glaeser and Gyourko point out that housing is affordable in most of the country despite zoning. In some parts of the country, however, “property rights have essentially been reassigned from existing land owners to wider communities, which have chosen to substantially reduce the amount of new building.” The result is that the supply curve for housing, which is nearly horizontal (meaning changes in demand have little effect on prices) in communities with traditional zoning, becomes very steep in the overly regulated communities (meaning small changes in demand can result in large changes in prices, i.e., prices will be more volatile).

Glaser & Gyourko make one interesting point that I had not raised. One of the impediments to housing production in California is a state environmental quality act that requires developers to assess the local environmental impacts of new housing. The result is that little new housing has been built in California, forcing people to move to places like Arizona and Texas. But California’s temperate climate means that greenhouse gas emissions there are far lower than in interior states. “If California’s restrictions induce more building in Texas and Arizona, which require far more artificial cooling,” says the paper, “then their net environmental [effects] could be negative in aggregate.”

Continue reading

Texas High-Speed Rail Still Not Viable

A few weeks ago, the Antiplanner reviewed the proposed Texas Central high-speed rail line between Dallas and Houston and concluded it was not viable. Last week, the Reason Foundation released a much-more detailed review that reaches the same conclusion.

Reason’s report notes that Texas Central officials claim they won’t need any subsidies, but still plan to ask the federal government for government-guaranteed low-interest loans. While Reason joins with the Antiplanner in supporting private rail projects, the desire for government-backed loans, says Reason, makes it “critical to assess the viability of this project.”

Reason’s assessment concludes that Texas Central officials have overestimated ridership and underestimated costs. As a result, ticket revenues are likely to fall almost $100 million per year short of operations & maintenance costs. Of course, that means there would be nothing left over to repay the government-guaranteed loans, so lenders would be out about $18 billion. That’s based on a construction cost of at least $20 million per mile based on the fact that the only high-speed rail lines that have been built for less had cheap or free right of way. Since the line in Texas would go over mostly private land, the right of way isn’t likely to be cheap.

Continue reading

APTA Ridership Data

Yesterday, the Antiplanner noted that APTA has published its third quarter ridership report for 2016. The report shows that, nationwide, transit ridership was 2.9 percent less than the same quarter in 2015. Heavy-rail ridership fell by 2.5% and bus by 4.4%, while light rail grew by 4.1% and commuter rail by 0.5%.

In addition to Washington, DC, where heavy rail fell by 13.5 percent, some of the biggest heavy-rail losers include Baltimore, which also declined by 13.5 percent; Atlanta (-9%); San Juan (-8%); and Miami (-5%). Ridership grew in a few places, but that growth was swamped by the 1.4% decline on the New York City subway, which is by far the largest heavy-rail operator in the country.

The main reason light rail grew was the opening of new lines in Seattle and New Orleans, both of which saw growth of around 60 percent, as well as Los Angeles, which saw a 12 percent gain. Light-rail ridership also grew significantly in Baltimore (15%), Boston (13%), and Phoenix (+14%), but light-rail suffered declines of 5 percent or more in Buffalo (-15%), Dallas (-6%), Norfolk (-7%), Pittsburgh (-9%), Sacramento (-9%), San Jose (-12%), and St. Louis (-6%).

Continue reading