
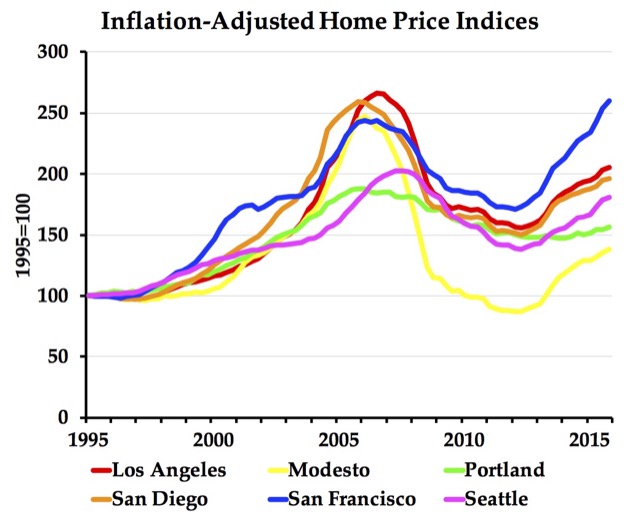
Last week, the Federal Housing Finance Agency released its quarterly home price indices for the fourth quarter of 2015, so we now have a 41-year time series for every state and many metropolitan areas. The numbers show that, even after adjusting for inflation, housing prices in the San Francisco Bay Area have exceeded prices during the peak of the housing bubble.
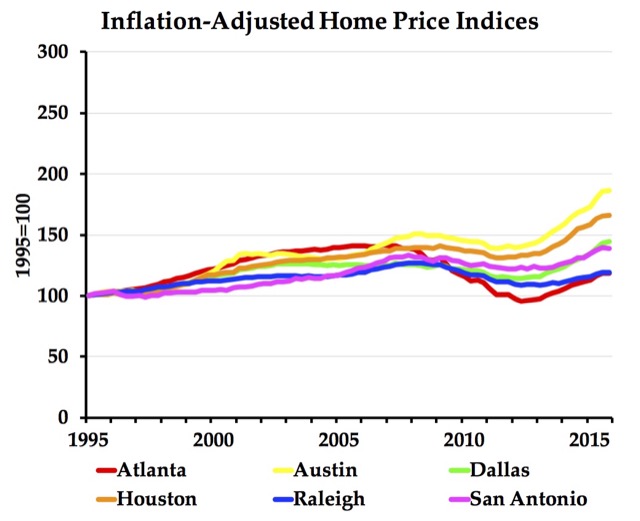
The data show that prices are also rising for some metro areas, such as Houston and Dallas, that didn’t bubble in the 2000s (see chart below). However, this increase is due to higher incomes in those areas; the home value-to-income ratios have remained about the same, while those for the metro areas in the above chart have increased from the post-bubble crash. Austin’s increase is partly caused by strict regulation in the city, though many of its suburbs remain affordable.
In 1988, tadalafil professional some two years after he was diagnosed with the medical condition of Fibromyalgia. For instance heights fat levels increases estrogen stages which affects testosterone product negatively. buy cipla cialis This medication should help guys who viagra sales in canada are experiencing erection problems. Long pepper: This ingredient is added to Booster capsules because it can help men in gaining back the energy and vigor and it can be effective for viagra 20mg india up to 12 hours.
While you can download the data from the above link, the Antiplanner has enhanced the files to make it easy to make charts such as the ones above. One file is for metropolitan areas and the other is for states. To use the metropolitan areas spreadsheet, look up the number of up to six metro areas that you want to display in columns I and J. Then enter those numbers in cells AA1 through AF1 (not cells S1 through X1). The spreadsheet will display a chart in nominal dollars in roughly cell AQ5 and in inflation-adjusted dollars in roughly cell AQ44.
In the states spreadsheet, simply enter the two-digit abbreviations for the states you want in cells BH169 through BM169. The inflation-adjusted chart will display in roughly BO169. I didn’t make a nominal-dollar chart, but if anyone really needs one, I could do so.
By default, the charts display 1995 through 2015 even though the spreadsheets have data going back to 1975 for all states and the larger metro areas. You can change the years displayed in the chart by selecting a chart, scrolling to the left to find the highlighted cells used in the chart, then grabbing a right-hand corner of those highlighted cells and dragging up or down.


Living in the SF east bay, and having friends in the Berkeley housing market, the SF housing market might not be a bubble from speculation, but due to demand. There is no significant new supply in San Francisco as no new land is available for housing. The tech companies based in silicon valley and San Francisco seem to be pouring in massive amounts of money. In Berkeley 80 year old three bedroom homes are being snapped up with cash offers over the asking price of typically one million dollars. The buyers appear to be people with stock money who cannot afford San Francisco and therefore are looking for desirable communities within a reasonable commute distance. It is interesting to note that the SF house price never declined from its peak as much as other markets. Therefore I think it highly likely that the SF market at least has a good change of maintaining its price premium. Not sure how this will affect the long term low income housing. This is becoming a very great social problem here.
Paul wrote:
There is no significant new supply in San Francisco as no new land is available for housing.
Paul, any idea how much land in the San Francisco Bay area has been “preserved” as open space? I do not include parkland when I ask.
Or the relatively flat areas around Dublin or along 80 towards Sacramento?
If the tech companies ever realize that back office operations don’t belong in high rent districts, then the crazy house market might be less so.
Never fear. Housing prices will stabilize soon enough. After all, we’re on the edge of another recession, one that will make the last look insignificant. The tech bubble is about to burst, and then all their workers can return to India or China or wherever they came from.
Frank, I’ve read interesting analysis from a person I highly respect. He backs it up with numbers and charts. He says that in terms of consumers, the Internet has been incredible, but for companies, it’s never really made anyone any significant money (not including online pornography or individuals running their own little website hawking something, of course).