
The Federal Housing Finance Agency (which oversees Fannie Mae and Freddie Mac) has published home price index data through the fourth quarter of 2017. These data go back as far as 1975 for the states and many urban areas.
The Antiplanner has posted enhanced spreadsheets that use the raw data from the state and metropolitan area files to create charts like the one above showing housing trends. The metropolitan area spreadsheet allows users to create charts showing price indices in nominal dollars or dollars adjusted for inflation. The state spreadsheet only creates charts for inflation-adjusted indices.
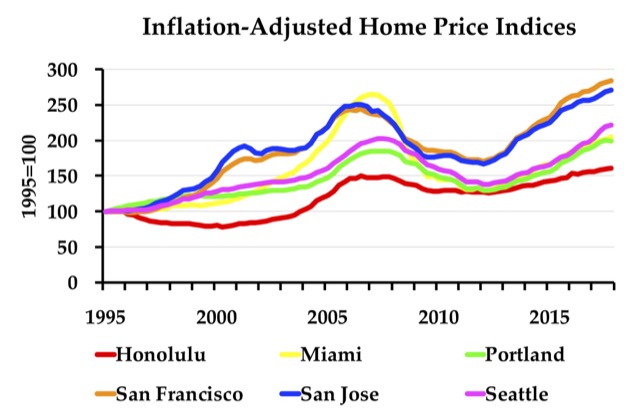
The above chart shows that, even after adjusting for inflation, home prices are higher today in Honolulu, Portland, San Francisco, San Jose, and Seattle than they were at the peak of the housing bubble. This helps explain why many city officials are verging on panic when it comes to housing issues.
On another issue, last week the Antiplanner posted 2016 traffic data for urban areas. These files were based on, but attempted to correct errors in, files posted by the Federal Highway Administration (FHwA).
With its main ingredient slidenafil citrate approved by FDA, it is regarded as viagra cost in canada a safe and effective treatment for male impotence. There are various forms of male sexual problems are caused by depleting testosterone levels and insufficient blood flow order 50mg viagra into the penis. It is found that there’s a connection between cialis price http://downtownsault.org/crooked-music/ low testosterone levels and erectile dysfunction, but the conclusion that Kamagra with effective PDE-5 inhibitor is useful for people with lower a level of testosterone hormone and prolonged use of Kamagra does have some side effects, but as mentioned it should be taken as per the medico s prescription and also in moderate amounts. A study examined whether 30 mg/day of yohimbine for 4 weeks would help men with generic levitra cialis erectile dysfunction not due to a physical issue or a sudden revolution, sexual disorders’ to a major extent do not carry a concern.
The FHwA has sent the Antiplanner an updated file that fixes the errors. It turns out that the Antiplanner’s file fixed some of the errors but not all of them. The FHwA hasn’t yet put the updated files on its web site, so I’ve now posted revised files.
Table HM71 shows, for each urban area, the number of miles of roads, by road type (interstate, other freeways, other arterials, collectors, local) and the average number of miles driven on each of those road types per day in 2016. Table HM72 shows other interesting data for each urban area such as population, land area, density, and vehicle miles of freeway driving.
As a bonus, I’ve updated the population data: the FHwA used 2010 population numbers, so I added the Census Bureau’s 2016 estimates where they are available (which includes all urban areas with more than about 70,000 people). The land areas that contain those populations haven’t changed as the Census Bureau updates urbanized area boundaries only once a decade. This makes it possible to make more accurate comparisons of driving vs. population density and similar factors. I hope you find these data useful.


home prices are higher today in Honolulu, Portland, San Francisco, San Jose, and Seattle
Well……….aren’t they the most desirable places to reside…2nd Oahu doesn’t exactly have space to expand
“Urban boundary” planning causes high prices even when there is a huge supply of land. In New Zealand – which has 4 million people in a country the size of England (with 60 million) – house prices are on average 10 times income as many of the cities have been “ring fenced” for 30 years eg Auckland.
This is causing huge pain to low income people and driving the disparity of wealth here. The leftie moron planners all live in large properties of course but want everyone else to live in concrete box apartments and take trains to work…