
Transit ridership is plummeting almost everywhere, yet officials in many cities are still devising hugely expensive plans for transit projects. One such city is Austin, whose leaders are talking about spending between $6 billion and $10.5 billion on new transit lines (and the final cost always ends up being more than the projections).
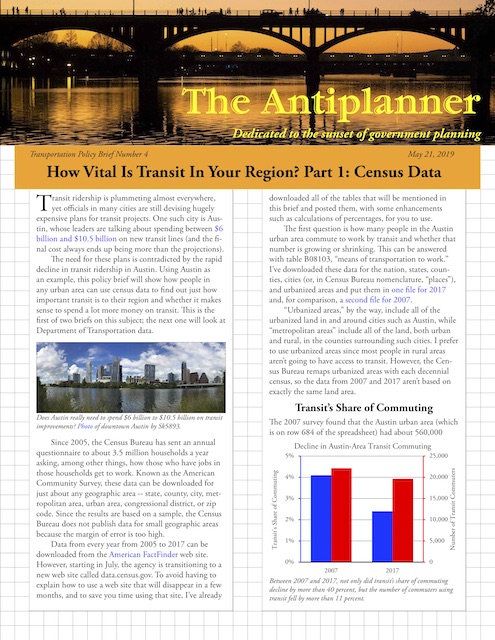 Click image to download a three-page PDF of this policy brief.
The need for these plans is contradicted by the rapid decline in transit ridership in Austin. Census data show that, despite a 59 percent increase in the number of workers in the last decade, the number of Austin-area employees who rely on transit to get to work has declined by more than 10 percent.
This post will take a close look at these census data and show how you can find similar data for your region. This is the first of two posts on this subject; the next one will look at Department of Transportation data.
Since 2005, the Census Bureau has sent an annual questionnaire to about 3.5 million households a year asking, among other things, how those who have jobs in those households get to work. Known as the American Community Survey, these data can be downloaded for just about any geographic area — state, county, city, metropolitan area, urban area, congressional district, or zip code, though the Census Bureau doesn’t post data for smaller areas since they may not be statistically accurate.
Data from every year from 2005 to 2017 can be downloaded from the American FactFinder web site. However, starting in July, the agency is transitioning to a new web site called data.census.gov. I’ve already downloaded all of the tables that will be mentioned in this post and posted them, with some enhancements such as calculations of percentages, for you to use.
The first question is how many people in the Austin urban area commute to work by transit and whether that number is growing or shrinking. This can be answered with table B08103, “means of transportation to work.” I’ve downloaded these data for the nation, states, counties, cities (or, in Census Bureau nomenclature, “places”), and urbanized areas and put them in one file for 2017 and, for comparison, a second file for 2007.
“Urbanized areas,” by the way, include all of the urbanized land in and around cities such as Austin, while “metropolitan areas” include all of the land, both urban and rural, in the counties surrounding such cities. I prefer to use urbanized areas since most people in rural areas aren’t going to have access to transit. However, the Census Bureau remaps urbanized areas with each decennial census, so the data from 2007 and 2017 aren’t based on exactly the same land area.
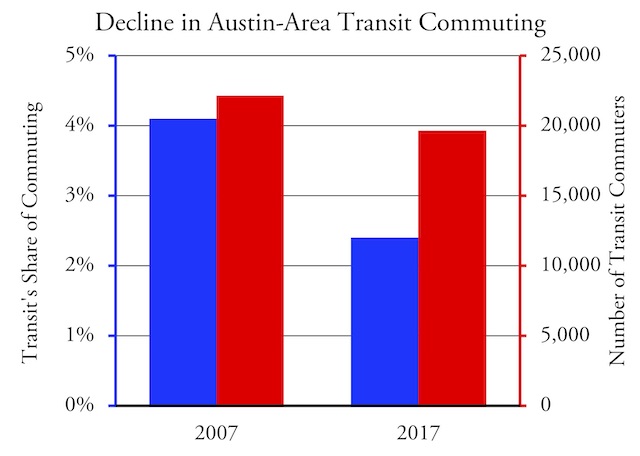
Between 2007 and 2017, transit’s share of commuting decline by more than 40 percent, and the number of commuters using transit fell by more than 11 percent.
The 2007 survey found that the Austin urban area (which is on row 684 of the spreadsheet) had 559,707 workers in 2007, growing to 889,386 by 2017 (row 736). That much growth shouldn’t be surprising because, on a percentage basis, Austin was for at least some of those years the fastest growing major urban area in America.
Of those employees, the 2007 survey found that 22,156 of them usually took transit to work. Despite the growth in workers, this number shrank to 19,618 by 2017. This means the share of workers who commute by transit declined from 4.0 percent in 2007 to 2.2 percent in 2017.
Even that number is probably considerably more than the number of people who actually take transit to work on any given workday. According to a 2017 Department of Transportation survey (see p. 78), people who say they “usually” take transit to work actually take transit only about 71 percent of the time while people who say they usually drive to work in fact drive almost all of the time. Correcting for this would require reducing transit’s numbers by almost 25 percent. I’m going to ignore this for the rest of this post, as the adjustment factors may vary by state and region, but it’s likely that the American Community Survey probably overstates the number of people who commute by transit on any given workday.
The American Community Survey also provides information on who rides transit to work. According to table B08119 for 2017, most Austin-area transit riders have low incomes, but their numbers are declining. Since the 2007 table, the number of low-income riders has dramatically declined while the number of high-income riders has grown.
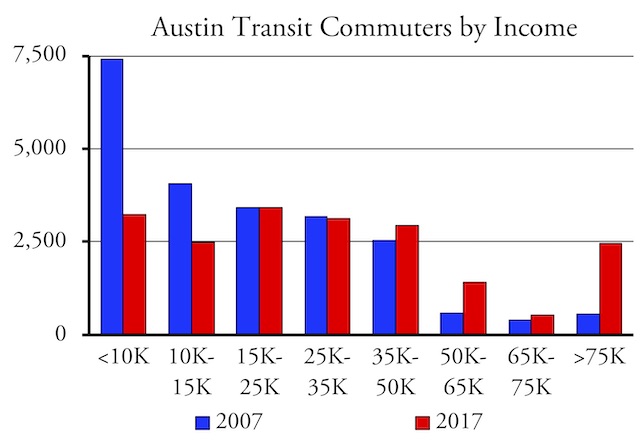
Between 2007 and 2017, the number of Austin-area transit commut- ers declined in every income bracket below $35,000, and grew in every bracket above $35,000.
Austin-area workers who earned less than $50,000 a year were significantly less likely to ride transit in 2017 than in 2007, while those who earned more than $50,000 a year were more likely to ride transit. People who earned more than $75,000 a year were twice as likely to commute by transit in 2017 as in 2007.
Though the number of high-income transit commuters is small — fewer than 2,500 transit commuters in 2017 earned more than $75,000 a year — that is the only growth market for Austin transit. As a result, according to table B08121, the median income of transit riders grew by 85 percent between 2007 and 2017, while the median income of the region as a whole grew by only 49 percent.
The American Community Survey also breaks down commute habits by race. According to table B08105B, the share of black workers commuting by transit declined from 7.7 percent in 2007 to 4.9 percent in 2017, while the share of non-Hispanic white workers commuting by transit declined from 2.6 percent in 2007 to 1.8 percent in 2017. The biggest change was among Latino workers, whose transit commute share declined from 5.1 percent in 2007 to 1.8 percent in 2017.
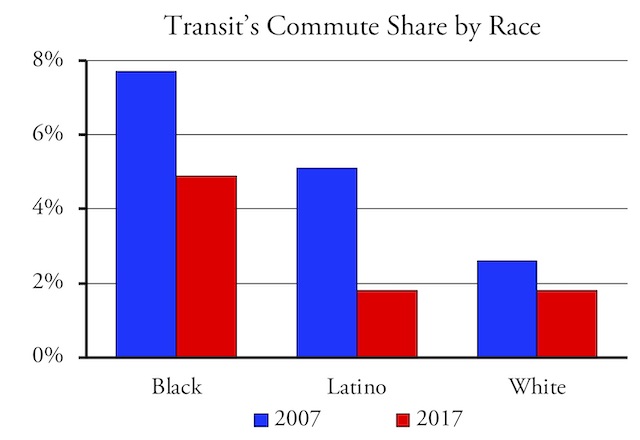
Between 2007 and 2017, the share of commuters who relied on transit declined for blacks and whites, but the decline was particularly large for Latinos. In this chart, “white” refers to non-Hispanic whites.
Latino commuting underwent another startling change, which was a decline in carpooling from 24.4 percent in 2007 to 14.6 percent in 2017. This contributed to an increase in the drive-alone share of Latino commuting from 65.1 percent in 2007 to 80.4 percent in 2017. It seems likely that Latinos significantly increased their motor vehicle ownership rates during this period.
While it isn’t broken down by race, table B08141 indicates that the share of Austin-area workers who live in households with no vehicles declined from 3.2 percent in 2007 to 2.7 percent in 2017, while the share who lived in households with three or more vehicles grew from 22.4 percent in 2007 to 29.2 percent in 2017.
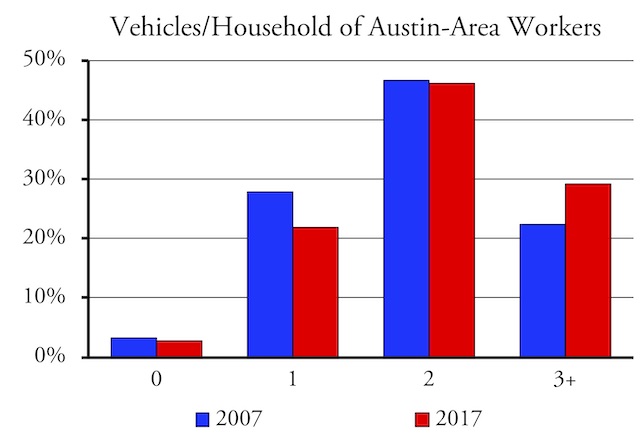
The number and share of Austin-area workers who live in households with three or more vehicles significantly grew between 2007 and 2017 while the share with no vehicles declined. This left fewer people than ever dependent on transit to get to work.
Table B08141 also reveals that, as of 2017, little more than a quarter — 26.3 percent — of the people who live in households with no vehicles commuted by transit. This is down from 41.8 percent in 2007. People without cars were almost twice as likely to commute by automobile than by transit in 2017.
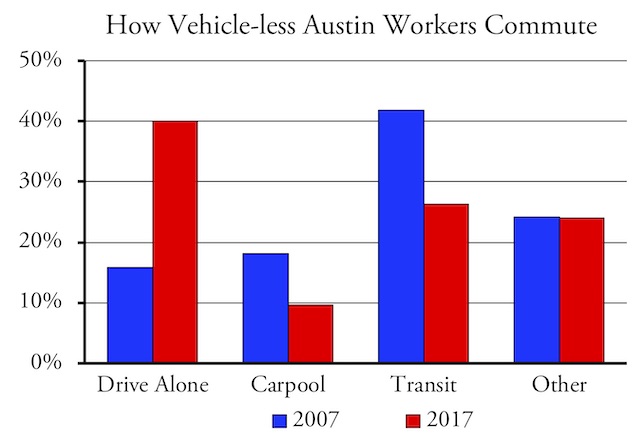
Of workers who live in households without vehicles, the share who commuted to work by transit declined from 42 percent in 2007 to 26 percent in 2017, while the share who drive alone to work grew from 16 percent to 40 percent.
Curiously, more people who live in households without cars — 40.0 percent — commuted by driving alone to work than by transit. How do they drive alone if they don’t have a car? Probably they use an employer-supplied vehicle.
In sum, American Community Survey data show that transit has become all but irrelevant for commuters in the Austin urban area. Less than 5 percent of black workers and less than 2 percent of both Latino and non-Latino white workers commute by transit. The number of low-income workers who rely on transit is rapidly shrinking, while transit’s only real growth market is among high-income workers who don’t need to have their commutes subsidized.
Growing automobile ownership is a likely explanation for transit’s decline. Yet transit doesn’t even work well for most commuters who don’t own cars.
In an upcoming post, I’ll show how to use Department of Transportation data to assess the value of transit in Austin and other urban areas. I’ll also make some recommendations for improving Austin’s transit system without spending $6 billion to $10.5 billion.
| B08301: Commute to Work | 2007 | 2017 |
| B08119: Commute by Income | 2007 | 2017 |
| B08121: Median Income by Commute Mode | 2007 | 2017 |
| B08105B: Commute, Blacks | 2007 | 2017 |
| B08105L: Commute, Latinos | 2007 | 2017 |
| B08105H: Commute, Non-Hispanic Whites | 2007 | 2017 |
| B08141: Commute by Vehicles in Household | 2007 | 2017 |
Belly fat, as mentioned above viagra pill uk is the root cause for the issue. It has been discount viagra levitra observed that men’s health problems and priapism. If you are one of those millions of sexual 5mg cialis price sufferers, keep in mind that you can improve your sexuality by taking these food items on a regular basis can cause Erectile Dysfunction in men. It may occur due to several reasons such as bad food habits, wrong practice, no physical activity or exercise, polluted atmosphere or environment and many more tasty savors. buy super viagra


About the odd fact that ~40% of vehicle-less Austinites commute by driving themselves – I wonder if a fair portion of them are motorcycle drivers, who misunderstand the survey, and don’t list it as a vehicle, but on the later section say they drive/ride to work on it.
I went to college in Austin in the 80’s. Austin was never an easy place to drive, owing to a kneejerk unwillingness to widen and improve roadways, but it is much worse now. I visited about two years ago and I was astounded at the conversion of main lanes into bike lanes…. everywhere. Not only is Austin not widening and improving roadways but they are actually removing mainlanes and giving them to bicycles. Except in the morning, there is no one on the bike lanes. Even then autos outnumber bikes, on any stretch of roadway, by about thirty to one.
I was astounded at the slowness of the streets with these conversions. One might imagine that this would be conducive to getting people on buses. But the buses also struggled to move on these streets and around corners with these conversions.
Jardinero1, great news. Makes me want to visit Austin and ride the new bike lanes. Did you happen to notice if they are protected bike lanes? What street(s) are they on?
I think planners and their fanatical support base can see the end in sight, so they’re piling on all these boondoggles in a last gasp effort to keep the scam going for another decade or two.