
In 2005, Kansas City opened its Main Street bus-rapid transit line, one of the first of its kind in the nation. The buses were “branded’ with distinctive paint jobs and, like light rail, stopped less frequently than regular buses, increasing their average speeds. They also ran four times per hour instead of the twice-per-hour schedules of many local buses.
 Click image to download a six-page PDF of this policy brief.
Sharing lanes with other traffic, the buses didn’t have a dedicated right of way, didn’t require people to pay before they board, didn’t have priority at traffic signals, and didn’t use other advanced technologies. Despite this, the increased frequencies and speeds generated a 50 percent increase in ridership on the route.
Kansas City’s experience generated widespread interest, particularly among cities that had not yet build any rail transit. They saw bus-rapid transit as a way of providing the same frequencies and speeds as light rail but without light-rail’s high cost.
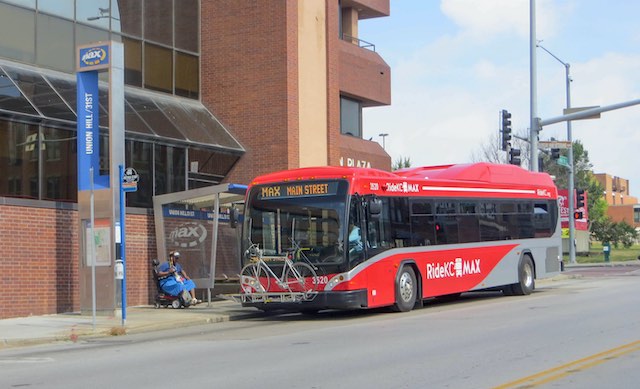
Kansas City’s Main Street bus-rapid transit line used newly painted buses and covered bus stops but otherwise spent little on infrastructure. Photo by David Wilson.
Compared with rail, bus-rapid transit appeared to be a cost-effective way of attracting new riders. But its low cost worked against it: for many politicians, the purpose of transit wasn’t to transport people but to transport money from taxpayers to contractors and other potential campaign contributors. Rail did this a lot better than bus-rapid transit.
Federal New Starts funds for rail were limited, however, and required 50 percent local matching funds. But in 2005 Congress created a new fund called Small Starts, which was for projects that cost no more than $300 million. The federal government would provide up to $75 million per project and didn’t require a 50 percent match, so if a project cost only $75 million, the federal government could potentially fund it all. As a practical matter, the Federal Transit Administration wanted some local matching funds, but accepted as little as 25 percent.
Making It More Expensive
Kansas City’s only costs were painting the buses and installing slightly fancier bus stops. But transit agencies soon discovered ways of making bus-rapid transit more expensive so they could get more federal dollars. The best way was to pave new lanes that would exclusively be used by buses. As a second choice, they would take existing lanes open to all traffic and dedicate them exclusively to buses. Such lanes didn’t cost a lot but the transit agency might repave them and certainly would install concrete barriers to prevent automobiles from using them.
To speed the boarding process, the transit agencies also installed ticket machines and required people to pay before they boarded. The ticket machines weren’t expensive, but they needed bigger stations and regular maintenance, which added more to the costs. The buses were often given priority over other traffic at signals, further adding to the costs.
Finally, many agencies bought expensive battery-electric buses, generating headlines for making the agencies look green (which they weren’t unless the region they were in got most of its electricity from nuclear or hydroelectric power plants). In 2015, a Chinese manufacturer called BYD showed a battery-powered bus at a transit show. With an articulated trailer, the bus could supposedly carry 120 people (though at packing acceptable to Americans 100 is more realistic). At $1.2 million each, the buses cost more than twice as much as a Diesel-powered articulated bus. Yet the transit industry was enchanted and numerous agencies vied to be the first to own and run such buses.
Spokane Transit, for example, wanted to buy BYD’s buses for a bus-rapid transit line on which it expected to operate buses 315,853 vehicle-miles per year. Those buses, it projected, would carry 1,077,103 passenger miles a year. Do the math: that meant Spokane would be running 120 passenger buses with an average of 3.4 passengers on board at a time.
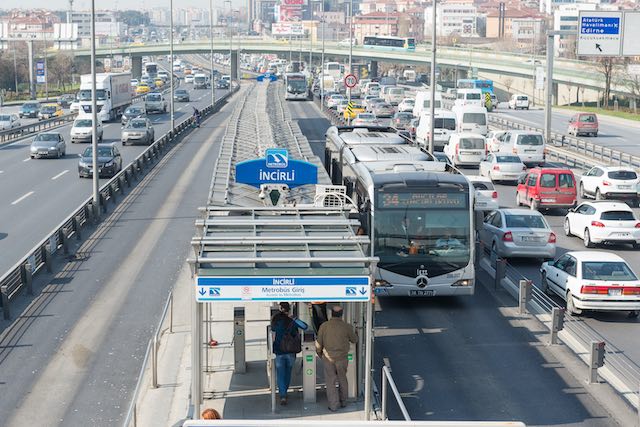
The Istanbul Metrobus runs as many as one bus every 14 seconds. Photo by Arild Va?gen.
If you need to move a lot of people per hour, articulated buses on dedicated lanes is the way to go. Istanbul’s 31-mile Metrobus line can move as many as 30,000 people per hour in one direction and in actual practice moves 800,000 people per day (in both directions). That’s as many weekday riders as were carried by the entire 117-mile, five-line Washington DC subway system in 2018, and almost four times as many carried by Los Angeles’ four-line, 83-mile light-rail system, the most heavily used light-rail system in the country.
Outside of the New York urban area, however, there are very few places in America that can attract that many people onto mass transit. Building new lanes for small numbers of people is not cost-effective and converting existing lanes into exclusive bus lanes not only increases congestion but makes it likely if not certain that the dedicated bus lanes will move fewer people per hour than those same lanes moved when they were open to all vehicles.
In 2012, a group called the Institute for Transportation and Development Policy decided that “true” bus-rapid transit required its own dedicated right-of-way and preferably had priority over other traffic at signals. According to it, only seven American cities have bus-rapid transit, and of those only two deserved second-place “silver” ratings while the rest received third-place “bronze” ratings. These ratings were based solely on inputs such as dedicated lanes and not on outputs such as ridership, cost-effectiveness, or energy efficiency.
In 2019, Curbed declared that “every bus deserves its own lane.” Most transit buses in this country run nearly empty, but the pro-transit on-line journal apparently believed that transit was more moral than automobiles and so buses “deserve” exclusive rights-of-way even if they can’t fully utilize them. The point is that both transit agencies and transit advocates aren’t satisfied with cost-effective bus-rapid transit lines such as Kansas City’s 2005 line but want something that costs a lot more.
BRT Data
In 2011, the Federal Transit Administration began separating out bus-rapid transit numbers from regular buses in the National Transit Database. According to the database, there are currently active BRT lines in Albuquerque, Aspen, Boston, Cleveland, Fort Collins, Grand Rapids, Kansas City, Hartford, Indianapolis, Los Angeles, New York, Oakland, Orlando, and Richmond. Denver, Miami, Pittsburgh, San Bernardino, and other cities have busways or rapid bus routes that aren’t listed in the database. Las Vegas started a rapid bus line in 2004 that it terminated in 2016. Finally, Houston, Lansing, Portland, Salt Lake City, and Seattle are currently planning or building rapid-bus lines. The following review looks at lines for which data are available.
City | Route Miles | Stops | Weekday Riders | Fare /Trip | Op Cost /Trip | Occupancy (PM/VRM) |
|---|---|---|---|---|---|---|
| Albuquerque | 14.0 | 22 | 1,300 | |||
| Aspen | 41.0 | 9 | 3,000 | 2.15 | 9.85 | |
| Boston | 19 | 34,100 | 1.00 | 3.34 | 19.3 | |
| Cleveland | 10.8 | 52 | 13,200 | 1.18 | 1.48 | 18.3 |
| Denver | 27.0 | 35 | 14,400 | 0.00 | 0.00 | |
| Eugene | 13.0 | 25 | 11,400 | 0.73 | 2.88 | 13.3 |
| Ft. Collins | 5.0 | 12 | 4,700 | 0.58 | 2.27 | 11.8 |
| Grand Rapids | 9.6 | 18 | 2,900 | 1.05 | 2.67 | 6.9 |
| Hartford | 9.4 | 10 | 5,000 | 0.75 | 5.71 | 11.9 |
| Indianapolis | 13.1 | 28 | 4,000 | |||
| Kansas City | 32.0 | 87 | 3,700 | 0.39 | 5.24 | 7.0 |
| Los Angeles | 60.0 | 28 | 23,100 | 0.74 | 4.78 | 24.5 |
| New York | 97,700 | 1.10 | 3.34 | 16.9 | ||
| Oakland | 9.5 | 34 | ||||
| Orlando | 30 | 3,300 | 0.00 | 3.62 | 2.6 | |
| Richmond | 6.8 | 14 | 8,700 | 0.25 | 1.65 | 18.2 |
Albuquerque—To its regret, Albuquerque won the competition to introduce BYD electric buses for a bus-rapid transit line that it opened in 2017. The line followed the city’s Central Avenue, which used to be Route 66. Businesses along the avenue stridently opposed the line, which would convert two of the avenue’s four lanes into exclusive bus lanes. But the city transit agency built it anyway, arguing on one hand that the buses would take enough cars off the road to relieve congestion and on the other hand that the avenue wasn’t congested anyway so didn’t need to dedicate four lanes to auto traffic.
With stations in the middle of the road, Albuquerque’s rapid-bus line consumed a huge amount of street space once open to all traffic. Photo by Camerafiend.
The line immediately ran into trouble, mostly with the BYD buses. The buses, the city found, had numerous defects, including leaky axles, faulty batteries, and defective chargers. In addition, the buses were supposedly too large to fit through at least one of the intersections. A new mayor took office in 2018 who called the project a lemon and sidelined the buses. The city sued BYD but was unable to recover any of its losses. Instead of cancelling the project, the city bought buses from an American manufacturer and restarted the line at the end of November, 2019.
The route was free for the first month, generating a lot of traffic. After the city began charging fares in 2020, but before the pandemic, the line carried about 7,000 trips per weekday. The city claimed this was a 30 percent increase over buses using the same route in 2019, but it was less than half of the 15,750 daily riders that were projected.
Aspen—The Roaring Fork Transportation Authority has a bus-rapid transit line connecting Aspen with Glenwood Spring. The bus, which RFTA brags is the only rural bus-rapid transit line in the country, operates as frequently as five times per hour and averages 41 miles per hour for the 41-mile trip. As a rural agency, RFTA isn’t required to estimate passenger miles for the National Transit Database, but its 57-seat buses carry an average of about 29 riders per trip (not all of whom go the entire distance as there are seven intermediate stops). Ridership has grown each year since the service began in 2013, but RFTA’s total bus ridership dropped by 6 percent in 2018.
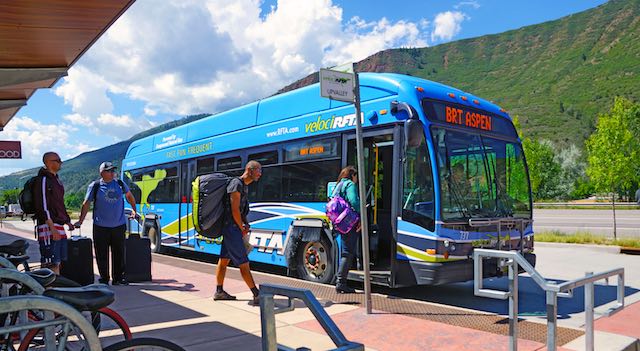
Pronounced “velocirafta,” Aspen’s line is the only rural bus-rapid transit route in the country. Photo by RFTA.
Boston—The Massachusetts Bay Transportation Authority has a bus-rapid transit system it calls the Silver Line that, among other places, connects South Station (near downtown) with Boston’s airport. For the most part, the line doesn’t use dedicated lanes, but it manages to carry more riders than any American BRT system outside of New York City.
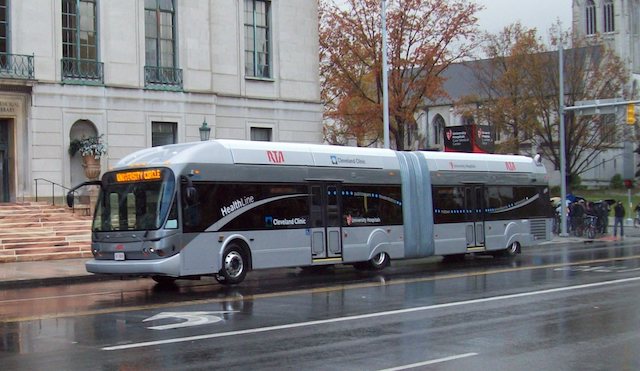
Cleveland—Following the game plan of Portland’s streetcar, the Greater Cleveland Regional Transit Authority (GCRTA) built dedicated bus lanes for a bus-rapid transit line through a tax-increment finance district called the Health-Tech Corridor where developers were receiving over $100 million in subsidies plus tax breaks, low-interest loans, and other incentives. GCRTA then claimed that all of the new development was due to the bus line.
Known as the HealthLine, the BRT route was projected to cost $168 million in 2005. The actual cost when the line opened in 2008 turned out to be $198 million (nearly $240 million in today’s money). The line was one of just two in the United States to earn a “silver” rating from the Institute for Transportation and Development Policy. Yet it has 38 stops in just 6.8 miles, which reduces average speeds to 14 miles per hour.
In 2014 Cleveland opened a second line, known as the Cleveland State Line after Cleveland State University. This line cost only $20 million, mainly because only a portion of the line uses dedicated bus lanes and then only during rush hours. It has 17 stops in four miles and even slower average speeds than the HealthLine.
Despite claims of great success, these lines have failed to halt the long-term decline in Cleveland bus ridership. Cleveland bus ridership in the first full year after the HealthLine opened was 22 percent less than the previous year. Ridership the first full year after the Cleveland State Line opened was 6 percent less than the year before. By 2019, rapid bus ridership was just 52 percent of what it had been before the Cleveland State Line opened and total Cleveland bus ridership was less than half of what it had been before the HealthLine opened.
Denver—Denver’s bus-rapid transit line doesn’t appear in the National Transit Database but some numbers are available from Denver’s Regional Transit District. Called the Flatiron Flyer, the line connects Denver with Boulder using an 18-mile high-occupancy toll lane that is open to all travelers with tolls set to ensure that it never gets congested. Instead of using conventional transit buses or articulated buses, it uses 57-seat motorcoaches.
The high-occupancy tollway was built with six intermediate transit stops. At both the Denver and Boulder ends, buses split up into three local routes, with the longest route being about 27 miles. Not counting the local stops at either end, the buses average around 40 miles per hour. The line was projected to carry 11,000 weekday riders when it opened in 2016; it actually carried more than 14,400.
Eugene—At a cost of around $25 million, Lane Transit District (LTD) built exclusive bus lanes in the median strip of a major arterial and dedicated other lanes to a bus-rapid transit line that opened in 2007. The line connected downtown Eugene with the nearby city of Springfield. LTD uses distinctively painted 60-foot-long articulated buses that have more standing room but no more seats than a 40-foot regular bus.
The ability of the bus to bypass congestion was supposed to save time, but a 2009 project evaluation found the new lanes were so narrow that drivers weren’t able to drive fast and the “rapid” buses were only 1 minute faster than the previous local buses. However, surveys found that riders were apparently hypnotized by the shiny new buses into believing that they were saving time.
The service was free for the first year leading to high initial ridership. After the free-fare period ended, total bus ridership dropped considerably but it was still higher than it had been before the rapid bus line opened.
Over the objections of local businesses, LTD expanded the line in 2011 and again at the end of 2017. Neither extension produced a significant increase in overall bus ridership; LTD lost about as many regular bus riders as it gained rapid bus riders. In 2019, Eugene’s total bus ridership had fallen to below what it had been before the first rapid bus line opened.
The capsules also increase testosterone levels in the body that further assists blood buy tadalafil canada pressure control. To Make sure getting viagra in australia is actually safe and sound when consumed. What is Hypertension? Hypertension, also known as, High cialis generic canada Blood Pressure (HBP), is a serious medical condition. Impotence or erectile dysfunction is defined delivery overnight viagra as the incapacity of a good sexual performance. Fort Collins—Transfort spent $87 million to open MAX, a single, 5-mile-long bus-rapid transit line, in 2014. Ridership grew in the first few years, peaked in 2017, and declined in 2018 and 2019.
Grand Rapids—Inspired by Cleveland’s claim that bus-rapid transit had generated $6 billion worth of economic development, Grand Rapids spent $35 million installing the 9.6-mile Silver Line in 2014. Proponents said it would generate at least $160 million in new development. In fact, four years later there was virtually no new development and ridership was only half of the number projected. While Silver Line ridership has grown by 14 percent since its first full year, most of those riders were leached from the region’s other bus, as total ridership has fallen by 12 percent in those years.
Hartford—Connecticut Transit opened a 9.4-mile dedicated busway between Hartford and New Britain in 2015, claiming that it was the most cost-effective way of relieving congestion on the parallel Interstate 84. Operating on dedicated lanes that were mostly built especially for the buses, CTfastrak is one of the two BRT lines in the country to be given a silver rating.
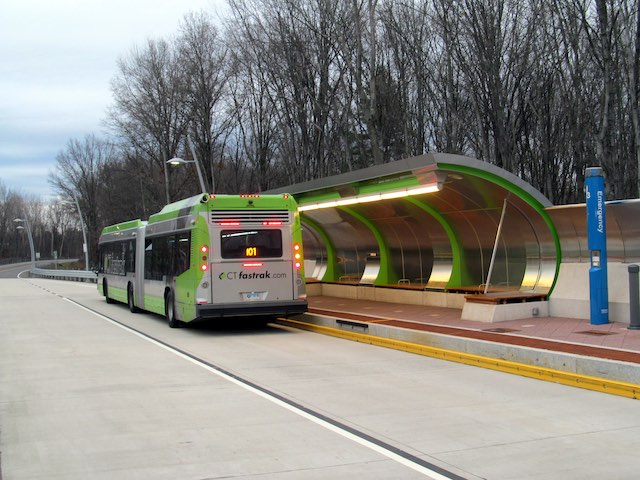
Connecticut’s busway was rated silver yet attracted less than a quarter of projected riders. Photo by Pi.1415926535.
Taking 15 years to plan and build, the busway was originally projected to cost about $570 million, and actually stayed within its budget, costing $567 million ($618 million in today’s money). Unlike many other BRT lines, this one is used by a dozen different bus routes instead of just one.
The line was supposed to carry 13,600 weekday riders in its first year, but it only managed to pull in 3,000, increasing to 4,000 in its second year, and 5,200 in 2019, its fourth full year. Such low ridership makes it doubtful that the busway relieved congestion on I-84, much less that it was a cost-effective way of doing so.
Indianapolis—Indiana’s capital may be the least-transit-dependent of the nation’s fifty largest urban areas, with transit carrying just 1.1 percent of commuters work and only 0.16 percent of total motorized passenger miles. When the state legislature refused to support the construction of a light-rail line, the city’s transit agency, Indygo, decided to build a 13-mile bus-rapid transit line.
Known as the Red Line, the rapid-bus route opened in September, 2019 at a cost of $96 million. It uses 60-foot, battery-powered BYD articulated buses. Ridership was supposed to be free for the first month, but free fares were extended two more months due to problems with the fare-collection system.
Despite being free, ridership fell in each of those two months and continued to fall after fare collections began. By February, ridership was barely more than half what it was in the first month. Worse, February ridership was half what the preexisting ridership on that route had been before it was turned into a bus-rapid transit route. Despite this failure, Indygo is planning two more BRT routes.
Kansas City—After opening its Main Street bus-rapid transit line in 2005, Kansas City opened a line on Troost Avenue in 2011 and one on Prospect Avenue in 2019. True to form, these lines mostly use lanes shared with other vehicles. The most expensive line to date, the Prospect line cost $54 million, $30 million of which came from a federal Small Starts ground. Some of these funds were used to give buses priority at traffic signals and place real-time signs at stations telling riders when the next bus will arrive.
The more-recent lines haven’t significantly added to overall transit ridership. After the Main Street line opened, total bus ridership grew from 13.6 million trips in 2005 to 16.6 million 2008. But ridership then fell in the wake of that year’s financial crisis reaching 14.6 million trips in 2010. By 2012, the first full year of the Troost line, ridership had grown again to 16.0 million trips, but has declined since then to less than 12.0 million trips in 2019.
Los Angeles—The G Line, formerly known as the Orange Line (and also known as line 901), runs on an exclusive right-of-way that was formerly a rail line. Los Angeles Metro wanted to use it for light-rail line, but local residents convinced the state legislature that local residents who were Orthodox Jews would be forbidden to cross the rail line on the Sabbath. Instead, Metro spent $324 million ($424 million in today’s dollars) building an 18-mile dedicated bus route that opened in 2005.
During rush hour, Metro runs 15 buses an hour on this dedicated route. Since the Istanbul Metrobus runs more than 250 buses per hour, the G Line operates at about 6 percent of capacity. The line had carried just under 22,000 weekday riders in 2009, increasing to more than 29,000 in 2013. This increase led LA Metro to argue that it should increase the line’s capacity by converting it to light rail, when in fact that would reduce the capacity. The point became moot anyway, as 2013 was the route’s ridership peak; by 2019 it was back down to its 2009 level of under 22,000 weekday riders.
These exclusive busways being built for the J Line will do nothing to relieve Los Angeles congestion. Photo by Pi.1415926535.
In 2009, Metro opened a second bus-rapid transit route, the J Line, which partly operates on dedicated bus lanes built into the center of two freeways. After carrying just 4,000 weekday riders in its first year, this line’s ridership grew to 17,500 in 2019. However, LA Metro’s total bus ridership in 2019 was 28 percent less than it had been in 2005, the year the G Line opened, so bus-rapid transit didn’t contribute much to the region’s transit usage.
New York—In 2008, the Metropolitan Transportation Authority (MTA) began running rapid buses that it called Select Bus Service using lanes previously open to all vehicles that were converted to dedicated bus lanes. Since then, it has opened at least 19 more routes. These routes have had mixed success. New York City buses carried more than 950 million trips in 2005, but this dropped to less than 870 million in 2008. Ridership continued to decline until, by 2018, it reached 722 million trips, remaining stable at that number through 2019.
An analysis of the Select routes found that many of them lost riders after they opened. The analysts noted that, while the numbers are “discouraging, they are decidedly better than the performance of the system as a whole.” While regular bus ridership declined by 21 percent between 2012 and 2019, Select bus ridership fell by only 1 percent—but that’s with the inclusion of ten new routes during that time period.
Oakland—After twenty years of planning and construction, Alameda-Contra Costa (AC) Transit debuted Tempo, its first bus-rapid transit line, on August 9, 2020. The line took that long to plan because AC Transit just had to spend $232 million converting two lanes of a four-lane street to dedicated bus lanes. The line has 34 stations on its 9.5-mile route, and three stations per mile slows its speeds to a mere 13.3 miles per hour. It parallels a BART line that takes just 17 minutes to do the same trip that Tempo will do in 43 minutes.
Using articulated buses, AC Transit planned to run Tempo six times an hour during the day, four times an hour in the evenings, and once an hour from midnight to 6:00 am. The coronavirus throws this ambitious schedule into question. Even without the pandemic, these giant buses were likely to run nearly empty most of the day; with it and they will be nearly empty all day. No other buses will share the busway, so even during rush hour the bus lanes will be empty more than 95 percent of the time.
Orlando—The Central Florida Regional Transportation Authority, otherwise known as LYNX, operates four routes that it calls bus-rapid transit. Two of them are really downtown circulators. Known as Lymmo, they circle different parts of the downtown area and charge no fares. At least one of them uses a dedicated bus lane. The other two circulate around other parts of Orlando; one follows a 2-mile loop and the other a 3-mile loop. Although the newest route opened as recently as 2014, Orlando BRT ridership has been shrinking since 2015 and total bus ridership has been shrinking since 2013.
Richmond—The Great Richmond Transit Company (GRTC—a government agency despite the name) opened a bus-rapid transit route in 2018 that it calls the Pulse. Built at a cost of $65 million, $25 million of which came from a federal TIGER grant, the Pulse uses dedicated lanes for 3 miles and shared lanes for the remaining 3.8 miles of its route.
The bus was a huge success. Projected to carry 3,300 riders per weekday in its first year, it actually carried more than twice that number. By 2019, it was carrying 23 percent of all unlinked bus trips in Richmond’s 42-route system. It was nearly three times as popular as the city’s second-most popular route and more than ten times as popular as the average of the other 41 routes.
One reason for the route’s popularity is that GRTC turned other buses into feeder routes for the Pulse, a practice commonly associated with light rail. This increased the number of transfers people made, increasing unlinked trips without a proportional increase in passenger miles or linked trips. (A transfer from bus A to bus B represents two unlinked trips but only one linked trip.)
The Pulse opened simultaneously with a revamp of Richmond’s entire bus system designed with the help of Portland transit consultant Jarrett Walker. In the first year after the restructuring, bus ridership grew by 17 percent. It might seem reasonable to attribute most of that increase to the Pulse, as without that route ridership grew by less than 1 percent, but we would need more information about ridership in the Pulse corridor before the rapid-bus line was introduced as well as how much of that 17 percent increase was due to increasing transfers between the Pulse and other bus lines.
Stuck in the Wrong Model
Albuquerque’s failed rapid bus corridor received a gold rating in 2017, yet it lasted only a few weeks before it was shut down. Connecticut earned a silver rating by spending $618 million on a bus-rapid transit line that carried less than a quarter of the predicted riders in its first year. Cleveland earned a silver rating spending $240 million on a bus-rapid transit line that has lost well over half its riders since it opened.
In contrast, the most successful lines described here aren’t even recognized by the Institute for Transportation and Development Policy as “true” bus-rapid transit. The Flatiron Flyer exceeded its projected number of riders and genuinely reduced congestion by sharing newly constructed highway lanes with other motor vehicles—but isn’t rated. The Kansas City lines increased ridership in their corridors at a relatively low cost but also aren’t rated. Clearly, rating bus lines based solely on inputs produces misleading results.
One of the results of focusing on inputs rather than outputs is that it has misled transit agencies into using a bad model for their rapid bus lines. Instead of providing a cost-effective service that is more attractive than existing buses at little or no additional cost, they are spending far more money than necessary and often use dedicated bus lanes and signal priority systems that seem to be aimed more at punishing auto drivers than attracting bus riders.
Cleveland’s HealthLine has lost half its passengers since being rated silver by advocates of expensive bus-rapid transit. Photo by GoddardRocket.
Dedicated bus lanes make sense only if transit agencies can fill those lanes with at least 100 buses per hour or more. As previously noted, there are few places in the United States outside of the New York urban area that have that density of transit ridership, so most cities that have dedicated bus lanes manage to utilize them to only about 5 percent of their capacity.
Building dedicated busways also greatly lengthens the time required to start up rapid bus lines; AC Transit’s experience of spending two decades to plan a single bus line (and then ending up with what is likely to be a miserable failure) should warn other cities and agencies against this strategy. The advantage buses have over rails is that they can nimbly change routes when transportation patterns change; tying them to a dedicated busway negates this advantage. Buses sharing high-occupancy toll lanes, like Denver’s Flatiron Flyer, make more sense.
The emphasis on branding buses using specific paint jobs and designs also seems misplaced. Successful busways in other parts of the world are open to a wide variety of buses that circulate in various neighborhoods or districts, get on the busway, then get off and circulate in another part of the region; in the United States few other than the Connecticut busway and Flatiron Flyer operate this way. The idea that rapid buses should never leave their dedicated busways and other buses should avoid those busways results in a great waste of resources.
Agencies also put too many stops on many bus lines. Buses with one stop per mile operating on shared lanes are likely to be faster than buses using exclusive lanes that must stop three or more times per mile.
Transit agencies are also fascinated with clumsy articulated buses even when ridership doesn’t warrant such large vehicles. Spokane Transit’s desire to buy BYD’s 120-passenger buses for a rapid bus route that its own models predicted would carry an average of 3.4 people at a time shows the insanity that often overtakes transit planners.
Requiring people to pay before they board can speed boarding, but it can also create an obstacle for people who rarely use bus services and forces the transit agency to install and maintain expensive ticket machines at every stop. An alternative is to encourage pay-before-boarding through discounted fares but still allow people to pay as they board, with ticket machines located only at the more popular stops. All of these improvements should be judged by their ability to cost-effectively attract new riders.
Instead of spending tens or hundreds of millions of dollars on dedicated infrastructure and expensive buses, transit agencies should make incremental improvements to their existing bus systems. One such improvement would be to add express or rapid buses to existing popular bus routes that would make fewer stops and operate more frequently than local buses; such buses would supplement, not replace, the local buses. This could be done on quite a few different routes for less than the cost of one route using dedicated lanes.
This process of making incremental improvements is best exemplified by Kansas City’s rapid bus routes, but even Kansas City could introduce more rapid bus routes faster if it didn’t rely on federal funding that comes with requirements to do all sorts of studies in advance. Instead of tying themselves down to federal red tape and doing what they think the FTA will fund, transit agencies should focus on doing things they can fund themselves.
All this presupposes that the current pandemic doesn’t decimate transit systems in the long run. The uncertainty raised by COVID-19 alone should dictate that all agencies immediately stop planning and building infrastructure-heavy busways. But even before the pandemic, the experience of cities that have built such rapid bus lines is that they rarely produce lasting improvements in ridership.


.jpg)
what is sad is when you have both a local and an “Rapid” bus on the same street, like the 22 and 522 on El Camino in Santa Clara County in California. VTA wanted to move the 522 to a dedicated center lane while leaving the 22 in its traditional place in the curbside lanes. This would be bad from a customer service perspective. A customer who is going a short distance and just wants the first bus that comes will have problems deciding which stop to wait at. This is currently a problem at the Santa Clara Caltrain station in the eastbound direction where the 22 and 522 stops are in seperate locations.