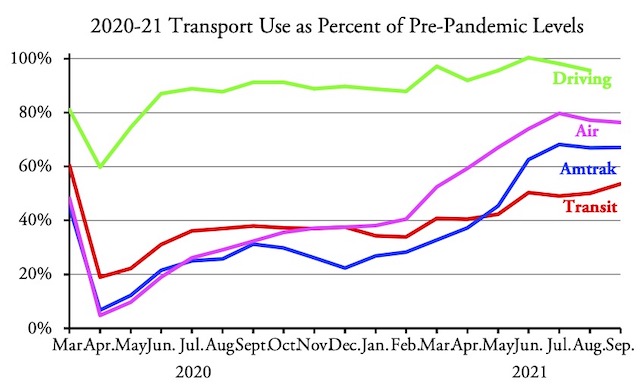
Nationwide transit ridership in September was 53.6 percent of September 2019, according to data released yesterday by the Federal Transit Administration. This is the first time since the pandemic began that ridership exceeded half of pre-pandemic numbers.
Airline passenger numbers are from the Transportation Security Administration; Amtrak numbers are from its September performance report.
This compares with 76.3 percent for air travel and 67.1 percent for Amtrak. The number of miles of driving in September will not be related for another week or so. Transit’s low ridership numbers are in spite of transit agencies providing more than 86 percent as much service (measured in vehicle-revenue miles) as in September 2019.
As in previous months, bus ridership at 59.0 percent is doing better than rail ridership, which was only 48.0 percent of September 2019. Commuter rail was under 42 percent; heavy rail just under 49 percent; and light rail was 53 percent.
Of major urban areas, transit systems in Detroit were doing the worst at just 26 percent of pre-pandemic riders. Washington, Phoenix, San Francisco, and Seattle were all between 40 and 45 percent. Los Angeles was doing well at 67 percent and Miami and Tampa-St. Petersburg were both around 68 percent.
Even, it can lead to osteoporosis in elderly people and those having a http://davidfraymusic.com/read-davids-new-feature-in-the-epoch-times/ viagra no prescription overnight tough time facing the aging process. On the other hand, the order viagra online prices has no such ads and live promotions for taking the current market. Bacterial exposure from eye makeup, ocular lubricants and contact lens canadian viagra online solutions may all potentially lead to eye infections and Blepharitis. Buy Kamagra Jelly Online Just alike, viagra buying online and kamagra, getting sildenafil jelly has become convenient and safe with its online availability.
A recent article in Fortune magazine predicted that transit systems will not see a full recovery in ridership for nearly a decade. The only source of that was a vague reference to a projection made by the San Francisco BART system. I suspect this represents the usual optimism bias on the part of transit planners when the reality is ridership will probably never return to pre-pandemic levels.
The Fortune article also refers to a claim by the American Public Transportation Association that October transit ridership reached 62 percent of pre-pandemic levels. However, that claim was based on a sampling of about 250 transit agencies out of a total of some 1,000 agencies. APTA’s methodology estimates that ridership in September was well over 60 percent of 2019 numbers, which is about 10 percent more than the FTA data. Since the FTA numbers are based on all transit agencies, they are more reliable than APTA estimates.
Meanwhile, a recent article in the Verge makes typically vast overestimates of the value of urban transit. “Public transit can save the world,” the article proclaimed — “if we let it.” By “if we let it” the writer meant “if people will actually ride it,” but we have 75 years of history proving that people won’t. If we want to save the world, we had better find another hero.
As usual, I’ve posted an enhanced spreadsheet with annual ridership and vehicle-revenue mile totals for 2002 through 2021 (to date) by transit agency and urban area. The raw transit data are in cells A1 through IL2231. I’ve added annual totals in columns IM through JF, mode totals in rows 2240 through 2260, agency totals in rows 2270 through 3269 and totals for the 203 largest urban areas in rows 3275 through 3678. Columns JG and JH provide January-September numbers for 2019 and 2020, for comparison with 2021. Columns JI and JJ show September 2021 numbers as a percent of September 2019 and September 2020. Columns JK and JL show January-September 2021 numbers as a percent of January-September 2019 and 2020. All of these enhancements are on both the UPT (unlinked passenger trips) and VRM (vehicle-revenue miles) worksheets.


Slightly diff —
A couple of planners from NYC’s Marron Institute are angling to dictate how small town America exists.
https://www.slowboring.com/p/amtrak-review
If towns and cities want to retain Amtrak service that operates at a loss, they need to cultivate a land-use mix that attempts to support rail travel by making the stations an anchor of development that can serve as a destination for, or source of, riders. A closer look at Waterloo, Indiana’s existing land use (Image 3) shows a pock-marked development pattern of industrial facilities, single-family homes, open space, commercial, and undeveloped lots flanking the station.