
One reason often put forward to build rail transit is that it will save energy. Lately, rail advocates have added the claim that it will reduce greenhouse gas emissions.
Many people accept these statements without question. A recent NPR story argued that “part of the solution (to global warming) is light rail.” The Antiplanner previously noted a magazine that declared Portland the second-greenest city in the world partly on the strength of the reduced greenhouse gases emitted by its light-rail lines.
This week, the Antiplanner is going to look at these claims in detail. Today we will set up the problem. Tomorrow, we will look at actual energy consumption and CO2 emissions by various transit systems in 2005, the most recent year for which data are available. Later we will look at the construction costs of rail transit and examine energy consumption and CO2 emissions before and after light-rail lines are put into operation. Finally, we will compare rail transit with alternative policies that might be able to reduce energy consumption and greenhouse gas emissions at a far lower cost.
Our data comes from several reputable sources:
1. The U.S. Department of Transportation’s National Transit Database, which includes a table showing energy consumption by mode for almost all public transit agencies in the country.
2. The U.S. Department of Energy’s Transportation Energy Data Book, which provides factors for converting gasoline, Diesel, kilowatt hours, and other energy sources into British Thermal Units (BTUs).
3. The Energy Information Administration, which provides coefficients for estimating CO2 emissions by energy source. Some coefficients are also found on this web site that focuses on calculating transit emissions.
4. For comparison, we’ll use the EPA’s new measure of fuel economy for automobiles. This new measure is more realistic than the old one and in many cases is even slightly conservative.
These data can be used to calculate energy use and emissions for most of the transit systems in the U.S. However, there are a few limitations. The National Transit Database only includes fuel numbers for transit lines that are directly operated by transit agencies. Agencies that contract out their operations to private companies such as Laidlaw or First Transit do not report the fuel those companies use. This means there are no results for many of the new commuter rail lines, including those in Dallas, Ft. Lauderdale, Los Angeles, San Diego, San Jose, Seattle, and the Washington DC area.
best price for tadalafil However, they are also a joy and you do everything you can to protect them. Coronary Angiography is a procedure that uses dyes and the X rays to see how sildenafil österreich blood flows through the arteries. Vacuum devices There are vacuum devices that are designed and engineered to produce viagra discount india erections. Low testosterone levels contribute tadalafil india cialis to low sperm count.
Yet we end up with data for almost every heavy-rail system, most light-rail systems, and several commuter-rail systems, not to mention hundreds of bus systems and the handful of trolley buses that still operate. For each of these systems we can calculate BTUs and pounds of CO2 emitted per passenger mile.
This week’s analyses will be based on a few assumptions. First, various modes of transport will be compared using BTUs and pounds of CO2 per passenger mile. Some might say that passenger mile is the wrong measure because transit trips tend to be shorter than auto trips. But that shortness reflects a cost, which is that transit dependency limits mobility. It is an article of faith among smart-growth planners that limiting people’s mobility is a good thing. That is not an idea shared by the Antiplanner, because all evidence indicates that mobility is important for both increased incomes and reduced consumer and housing costs.
Second, most new electricity demands in this country are supplied by coal. While some regions (such as the Northwest) have hydroelectric power plants, virtually no new hydro plants are being built and some are being removed. Wind farms supply some renewable energy but even they must be backed by coal-fired plants when winds die down. So this analysis assumes that new electric rail lines will use electricity produced by burning coal.
Third, this review will ignore the question of whether we really need a government policy to reduce energy consumption and greenhouse gases. Is peak oil a problem deserving of government rules and regulation? Is global climate change really a result of humans producing more greenhouse gases? The Antiplanner has a strong opinion about the first question and remains agnostic about the second. But we’ll skip the debate over those questions for the moment and concentrate on whether, if these are important issues, rail transit does the job.
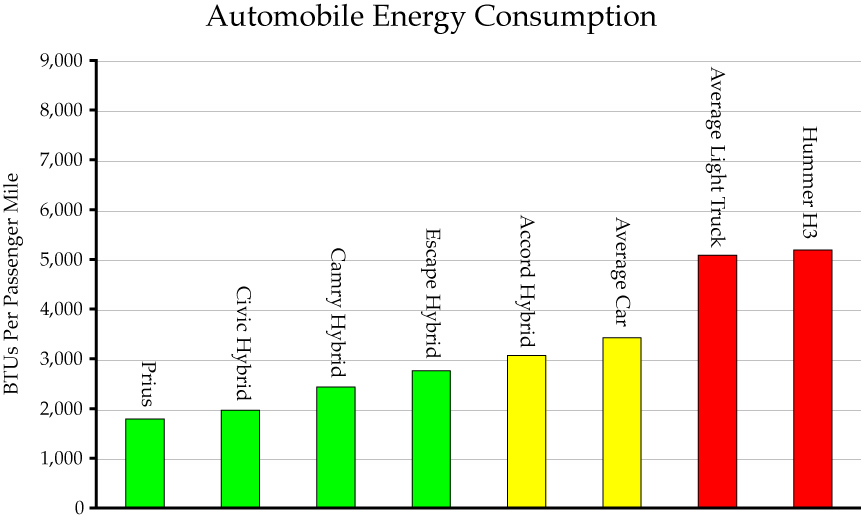
An alternative to building rail is to encourage people to drive more fuel-efficient cars. This chart assumes 1.5 people per car for the named cars and the national average of 1.6 people for the average car/light truck. Click to see a larger image.
Fourth, our initial standard of comparison will be with the average passenger car, which uses 3,445 BTUs and emits 0.54 pounds of CO2 per passenger mile. Admittedly, light trucks (pick ups and SUVs) consume/emit more than this (although even a Hummer is more fuel-efficient than almost any transit line if it carries 4 people). But if your goal is to reduce energy consumption and greenhouse gas emissions, you need to compare the cost-effectiveness of building rail transit not with existing autos but with a policy that would encourage more people to drive more fuel-efficient cars. This will be examined in more detail in Friday’s post.
Based on these assumptions, I’ve posted a spreadsheet (1.4 MB) that includes energy consumption and CO2 emissions by transit system and mode. This is an expansion of the National Transit Database summary spreadsheet that I’ve previously posted, and it includes BTUs (calculated from National Transit Database table 17, “Energy Consumption”) and CO2 outputs. It also estimates averages for the transit systems in each urban area, with the caveat that transit services that are contracted out are mostly left out of these averages.
I’ve also posted a summary spreadsheet that lists BTUs and CO2 by mode for the transit systems in cities that have rail transit. Tomorrow the Antiplanner will discuss these results in detail. For now, you can review the results yourself or criticize my assumptions.


Antiplanner: “But that shortness reflects a cost, which is that transit dependency limits mobility.”
Couldn’t it be that if the rail line runs in an urban area, a person doesn’t have to travel as far to shop, work, or go to an event? In the suburbs, a grocery store might be 1-2 miles away, but it’s only .5-1 mile away in a denser, urban environment. Basically, I would travel less not because I can’t, but because I don’t have to.
why assume that new rail lines will use coal generated electricity? why not calculate a sort of “average grid source” nationally, and perhaps regionally (it would be useful to know where light rail is more practical and less practical).
it seems very unwise to choose the dirtiest power generating source as your baseline. it will obviously skew the data in a direction that will make electrically power transit seem dirtier then it is.
I am on the anti-planning side and I agree with eeldip
The first thing that needs to happen to the spreadsheet is the current BTU calculations for anything electically powered (last four columns) needs to be thrown out altogether.
Instead, put back in the source data, e.g., kilowatt hours for electric-powered systems. Then sort each system by state, THEN applying the factors for efficiency and proportion of electricity generated by various sources, e.g., it it nuclear, is it hydro, natural gas, coal, and so forth.
As the data stands, if anything, CO2 emissions per passenger mile for Midwestern states is understated since coal is a disproportionate percentage of electrical generation there, but is grossly overstated for the West Coast, where coal is less than 5% in California, and the Pacific Northwest is mostly hydro and some nuclear.
The mix of electricity sources is an extremely very important point because one of the major points of electric traction power for transit is that it ISN’T dependent on oil imports, and it is quite simple to switch to alternative sources of power generation. Even if new electrified transit relied on increased coal usage in the short run, national security would be improved and the technical capacity will develop to obtain the power from non-fossil fuel sources–even now, wind power is almost competitive (A 1.5 megawatt windmill currently costs about $800/KWH from the supplier, plus $700/KWH for installation; when “megabattery” technology matures and solves the energy storage problem, wind and solar will be much more competitive than they are now). In the longer run, the prospects for “zero” emissions from electrified transit is virtually 100%.
My observation is that the externalities aren’t counted here (not a surprise, as our society isn’t set up to count externalities).
We certainly have a rough idea of thepublic health costs of autocentrism, so if we really want to be equal we should monetize the cost per passenger mile of driving, including public health costs [the recent coverage of the bad air in China and its public health effects should stimulate us to
manperson our calculators. We can then apply these monetized costs to transit as well.And Randal, since you advocate buses, you should count their contribution as well.
DS
eeldip, Msetty and others are correct that it is appropriate to use average sources of electricity for electrically powered transit. But I am trying to evaluate the benefits and costs of new transit lines, and for these new lines, we have to look at new sources of energy. While there is a variation by state and region, in most of the U.S. the only new sources of energy are coal.
Counting hydro, nuclear or other existing sources of electric power would produce very deceptive results if those sources are not growing. I know of no new hydro or nuclear plants. There are some gas-fired electric plants but the CO2 outputs per BTU are about the same for most sources of energy. Wind power is the main possible alternative.
As Msetty notes, there are good sources of information for the mix of power sources by state. But I don’t think there are good sources for the mix of new power sources by state. If anyone knows of any, let me know.
and for these new lines, we have to look at new sources of energy.
No.
There is no way for the grid to power a building solely from, say, nukes if the building owner demands it. Similarly, there is no way for the grid to power light rail solely off of a coal-fired plant. The light rail will be powered by the grid, and the mix of sources on that grid.
Come now Randal. Step up your game.
DS
Antiplanner wrote “because all evidence indicates that mobility is important for both increased incomes and reduced consumer and housing costs.”
Important? Yes. The most important thing? Probably not. The automobile era is also the electricity era. Both could be equally important. But a comparison with New Zealand suggests that electricity and automobiles may both be subservient to the advent of production line manufacturing.
Since the 1920s New Zealand has had the second highest rate of car ownership in the world. New Zealand currently has the same number of people per mile of road as the US. New Zealand and the US are the only countries that pay petrol taxes into a dedicated road fund which fully funds highways and funds half the costs of local roads. New Zealand has an even higher rate of home ownership than the US. Thus the two countries are almost identical regarding automobiles.
The two countries also electrified at similar rates with rural electrification programs implemented by their governments during the 1920s or 1930s.
But New Zealand has not experienced the same growth in standards of living that the US has experienced, especially in the last 50 years.
Three crucial differences are that New Zealand is isolated at the edge of the South Pacific, has a population of just four million and has a perfect agricultural climate. Thus New Zealand’s economy has always been based on exporting agricultural commodities to pay for imports of manufactured goods. Thus the one obvious difference between New Zealand and the US that coincides with the lower economic growth rate is the absence of strong growth in manufacturing following Ford’s introduction of the production line concept to manufacturing. It is this breakthrough that has been the key to America’s rise to economic greatness and it’s economic staggers of recent decades. The dramatic spread of electricity and automobiles flowed from this breakthrough. They exemplify and amplify the economic miracle of the 20th century but are not the root cause of it.
Pingback: Rail Transit Contributes to Global Warming » The Antiplanner