
Last week, the Antiplanner looked at Maryland’s Purple Line low-capacity rail (formerly known as light rail) project and showed that it both increased congestion and wasted money. Today, I’ll take a quick look at Baltimore’s Red Line low-capacity rail project, which is also being planned by the Maryland Department of Transportation (MDOT).
Some think MDOT wants to build the Red Line mainly for political parity: since it is planning the Purple Line in the DC metro area, it has to have a companion project in the Baltimore area. There may be some validity to this rumor as the Red Line is an even greater turkey than the Purple line.
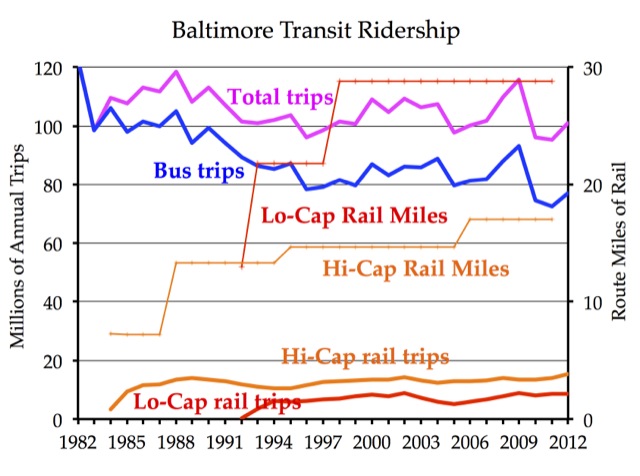
Despite–or perhaps because of–continued expansions in rail service, Baltimore has lost nearly two bus riders for every rail rider gained in the last two decades. Source: National Transit Database.
Since 1982, Maryland has built 17 miles of high-capacity rail (formerly known as heavy rail) and 29 miles of low-capacity rail lines in Baltimore. During that time, Baltimore’s population has grown by close to 37 percent but transit ridership has fallen from 122 million trips per year in 1982 to 101 million in 2012. That means per capita ridership has declined by 40 percent.
Another way of putting it is that each rail rider gained has been matched by nearly two lost bus riders. Nevertheless, MDOT planners want us to believe that a new, 14-mile low-capacity rail line will increase regional transit ridership by 18 percent (over no-build), or about 5 million new trips per year.
Today, transit carries less than 2 percent of motorized travel, and about 7.5 percent of commuters, in the Baltimore metro area. That’s a steady decline from 1970, when transit carried nearly 18 percent of commuters; in 1980 it was 13 percent; 10 percent in 1990 and 8 percent in 2000.
The project’s draft environmental impact statement (DEIS) considered six bus-rapid transit and four low-capacity rail alternatives. Many of the BRT alternatives required construction of expensive lanes that would be dedicated to buses; others dedicated existing lanes that are now open to cars to buses only. The various alternatives were projected to attract 29,000 to 42,000 transit riders per day, of which about 6,000 to 13,000 would be “new” riders who would otherwise use some other mode of travel (or, possibly, not travel at all). (These numbers are from page 5-5 of the executive summary.)
Back in 2000, Baltimore estimated that a low-capacity rail project in this corridor would cost about $152 million (less than $200 million in today’s dollars; see p. 6). By the time the 2008 DEIS was written, the costs had blown up to $1.0 to $2.5 billion, depending on the rail alternative. The current estimate, in year-of-expenditure dollars, is $2.2 billion, or more than $150 million per mile, making it even more expensive than the Purple Line.
The 2008 DEIS calculated the cost-effectiveness of each of the alternatives using the FTA’s then-standard method of dividing the annualized cost by the number of hours saved by transportation users per year. Under FTA rules then in effect, any project whose cost per hour was greater than about $25 was automatically ineligible for funding. All but one of the BRT alternatives, and all of the low-capacity rail alternatives, cost more than $25 per hour. One BRT and one rail alternative cost nearly $50 per hour. The alternative that comes closest to the selected alternative cost about $32 per hour. (Also from the executive summary page 5-5.)
As in the case of the Purple Line, MDOT counted only the time saved by transit riders when it calculated cost effectiveness. The time saved–or, more likely, lost–by auto and truck users was ignored. MDOT apparently did an analysis of the effects of the rail line on traffic, but the DEIS only summarizes that analysis on page 49.
Page 81 of one of the DEIS background documents does report travel times for a few intersections for just four alternatives: no build, transportation system management (meaning modest improvements to bus service), one BRT, and one low-capacity rail alternative. Overall, the BRT alternative did best, but the differences between the alternatives were minor. Moreover, since MDOT made no attempt to find an alternative that optimized auto travel in the corridor, it is hard to judge just how bad the congestion really is.
Maryland published the final EIS in December 2012, and it included only one low-capacity rail alternative plus “no build.” Perhaps aware that the Obama administration was jettisoning the $25 cost-effectiveness threshold, the FEIS doesn’t bother to calculate cost effectiveness.
Pages 4-48 through 4-50 look at the levels of service–an A through F rating of traffic congestion–in 2035 with and without the low-capacity rail. With rail, levels of service improve in some places and deteriorate in others. What the table doesn’t say is that the “build” alternative also includes mitigation measures, including new traffic signals and redesign of intersections, to offset the impact of the rail line (see pp. 4-38 and 4-39). Without those mitigation measures, levels of service would probably decline at all intersections. Put another way, doing the mitigation measures alone, without the rail transit, would significantly improve levels of service in the corridor.
Similarly, 4-45 compares auto travel times for various trips within the corridor with and without the low-capacity rail line. Again, some segments see improvements while others see declines. But it is impossible to tell how much of the improvement is due to the rail line and how much due to the mitigation measures.
What MDOT should have done for both the draft and final EISs is estimate the hours of time saved and lost by auto users as a result of each of the alternatives. Those hours should be been added to (or subtracted from) the hours saved by transit users in the cost-effectiveness calculation. This is why NEPA requires a thorough analysis of a full range of alternatives, not just an analysis of things that make the preferred alternative look good.
MDOT’s record of decision says, “The needs that exist in the project study corridor are: 1. Roadway congestion contributes to slow travel times for automobiles and buses in the corridor.” So relieving congestion is the primary goal of the project. Unfortunately, MDOT made no attempt to find the optimal way of doing so. Instead, it started by assuming that it would build an expensive transit project, and then–almost as an afterthought–made some token estimates of the resulting congestion.
You might expect such tunnel vision from an agency that exclusively handles transit. But MDOT’s mission covers both highways and transit, so the agency’s failure to take the needs of anyone but a few transit riders into account is particularly insulting to Maryland taxpayers and travelers.
One of the arguments against any rail alternative is the time required to implement it. Planning for this project began back in 2002. As planned, the line will open in 2021. A lot can happen in two decades to change the need for a project. Implementing modest signaling, street, and bus improvements would be much faster, less expensive, and less likely to be obsolete before they are completed.


The origins of the Light Rail go back to a transit plan drawn up for the Baltimore region in the 60’s that envisioned six rapid transit lines radiating out from the city center. Following White Flight and it’s drastically declining population after the late 60’s only one was completed by 1983. That systems was the Metro Subway. When it got it’s first Light Rail line in 1992, since then it “achieves” 27,000 daily riders (assuming that’s to and from for the people using it, that would really be 13,500 daily riders or 2% of the cities 621,000 people or it’s metro of 2.9 million that’s 0.4%). The average speed of the light-rail Blue Line in Los Angeles is 21 miles per hour, and LA’s heavy-rail Red Line moves at 24 miles per hour. Also, estimates of rail speed uniformly ignore the time required for the patron to get to the station and wait. Studies in Los Angeles have shown that overall travel times on rail transit are longer than the same trips
on the old bus routes; Los Angeles once had a reputation for good transit. Rail is not a road/highway decongestant; in fact many drivers willingly support rail on the basis that enough drivers will get off the roads and use the rail. Of course nearly all the drivers suspect others will use the rail and none of them do. It’s coined a joke by the Onion, where polls showed “98% of American’s believe others should take Transit”
LazyReader wrote:
Of course nearly all the drivers suspect others will use the rail and none of them do.
Actually, the bus riders get forced onto rail when their bus lines are turned-back at a rail station or discontinued entirely.
It’s coined a joke by the Onion, where polls showed “98% of American’s believe others should take Transit”
Best. Ever. Onion article.
The other question to be asked is “where are the jobs?”
In the Baltimore region, they are no longer in downtown Baltimore City.
The Social Security Administration complex at the west end of the proposed Red Line has about 6,300 workers (according to the SSA). But it’s not at all clear how many of those workers live in places that would be served by the Red Line. I believe a fair number of them live west of Woodlawn along or near I-70 in Howard County (I-70 has its eastern terminus in Woodlawn).
At the east end of the line is Johns Hopkins Bayview Hospital. This is a big complex, though it is only part of the massive Johns Hopkins Medicine organization in Baltimore (it employs over 30,000 people in total, only some fraction of which are based at Bayview). But like the Social Security complex, Bayview is well-served by Interstate highways (Florida-to-Maine I-95 and one of it spurs, the I-895 (Baltimore Harbor Tunnel Thruway) toll road.