A New View of Congestion

The GPS company TomTom recently published its rankings of urban areas by the amount of congestion people face. Like many other congestion studies, the rankings estimate the amount of time the average motorist wastes during rush hour. But that may not be the best measure of mobility.

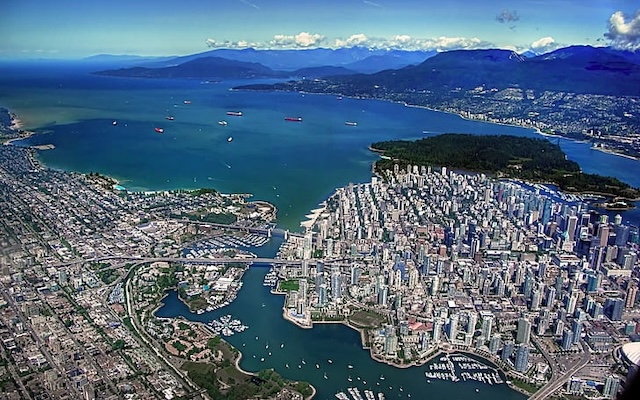
Is Vancouver the most congested urban area in the U.S. or Canada?

TomTom also listed the average speed of traffic in each city center and metro area, both during rush hours and over the course of a day (calculated using the number of minutes required to go six miles). The time wasted was calculated by measuring how much slower traffic was during rush hour compared with the rest of the day. Urban areas could reduce the hours of delay by increasing traffic speeds during rush hour. But they could also reduce the calculated hours of delay by reducing traffic speeds during non-rush-hour periods. Continue reading

The Best State to Live in Is . . .

Louisiana is the worst state to live in, according to self-storage company Pink Storage. The company has rated the 50 states using sixteen different criteria including income, congestion, housing, education, crime, and life expectancy. California is the fifth-worst, thanks to its low housing affordability, followed by South Carolina, Arizona, Tennessee, and the afore-mentioned Louisiana.

Any state that has scenery such as this doesn’t look too unlivable to me. Photo by glynn424.

Louisiana, South Carolina, and Tennessee score poorly on income while Arizona is mediocre to poor in several categories including high school graduation rates, number of police per capita (though its crime rates aren’t particularly high), and utility bills (to pay for air conditioning no doubt). Other states at the low end of the scale include Texas, Nevada, Oregon, Hawaii, and Alabama. Continue reading

A Legal Challenge to Austin’s Light-Rail Plans

Texas Attorney General Ken Paxton is asking a state court to cancel Austin’s light-rail plans. Capital Metro, Austin’s transit agency, persuaded voters to raise taxes to build light rail in 2020. Soon after the vote, however, the agency admitted that rail would cost a lot more than it had claimed and so less would be built than promised. Paxton says that in doing so it has breached its contract with the voters and its plans should be rejected.

Imagining light rail in Austin. Smiling happy people, no cars, and no crime make this scene a complete fantasy. Source: Project Connect.

Paxton has gotten in trouble over securities fraud and has taken positions on abortion and immigration that I disagree with. I am sure there are rail transit advocates who are gnashing their teeth over the idea that a lawsuit could overturn the “will of the people” to build light rail in Austin. But, while I am obviously biased, I think that defining the election as a “contract” and ruling it invalid if Capital Metro can’t keep its part of the contract is a great idea. Continue reading

A Mere $100 Billion More

The California High-Speed Rail Authority recently released a new draft business plan saying that it needs only $100 billion more to finish the project. The plan admits that the agency expects to spend more on the 171 miles between Merced and Bakersfield than the $33 billion it had projected the entire 463-mile project would cost when voters approved it in 2008. Even with a recent federal grant, the agency only has about $25 billion for the project, most of which it has already spent.

Click image to download a 17.8-MB PDF of this plan.

As shown on page 65 of the plan, the current projection is that the final cost of the project will be between $89 billion and $128 billion, with $106 billion supposedly being most likely. It pairs this with a projected cost of $211 billion “that would be necessary to construct the equivalent highway and air passenger capacity.” However, this is entirely bogus. It assumes, for example, that the only way to increase airline capacities is by building new airports; increasing the size of planes flying between LA and San Francisco is somehow impossible. It also assumes that new freeway lanes would have to be constructed the entire distance between LA and the Bay Area, even in places that aren’t expected to be congested in the future. Continue reading

San Jose Transit Insanity

Someone recently asked me what I thought were the nation’s worst-managed transit projects. I suggested the Honolulu rail was number 1, the Maryland Purple Line was number 2, and BART to San Jose was number 3. But maybe I underestimated the insanity of the BART-to-San Jose line.

It’s even worse than Mr. Arnold suggests. In 2001, the Santa Clara Valley Transportation Authority (VTA) did its initial alternatives analysis comparing BART with a wide range of alternatives including buses, bus rapid transit, commuter rail, light rail, and “Diesel light rail,” which is what the FTA now calls “hybrid rail.” BART was picked because they thought it would get the most riders even though it was also by far the most expensive. Continue reading

Why Do Democrats Support Transit?

“What drives Republican opposition to transit?” asks Governing magazine. I’ve often wondered the reverse of this question: Why do Democrats support transit?

Every rider gained by new light-rail lines in Los Angeles correspond to five or more lost bus riders. Photo by SounderBruce.

Governing‘s implicit assumption is that transit is a good thing and anyone opposed must have some warped reason to question it. The magazine’s answer is that opposition to transit reflects an urban-rural divide and since Republicans are more likely to represent rural areas that get less or no transit service than urban areas, they have little reason to support it. This belief may be why the Federal Transit Administration is so eager to support rural transit as it is a way to co-opt more political support for transit in general. Continue reading

January Miles of Driving 99.5% of 2019

In January 2024, Americans drove 99.5 percent as many miles as they did in the same month of 2019, according to data released yesterday by the Federal Highway Administration. This compares with 103.1 percent in December.

See this post for a discussion of Amtrak and air travel and this post for a review of transit data for January 2024.

January had the same number of business days in 2024 as in 2019, so that doesn’t account for the drop below 100 percent. Instead, this drop is more likely due to the mid-January snowstorm that blanketed much of the United States. Continue reading

Reforming Canadian Transit

As in the U.S., many Canadian transit agencies are fixated on building 19th-century transit systems that make no sense today, says a new report from the Frontier Centre for Public Policy. Instead of focusing on downtowns, as these transit agencies are doing, the report urges cities to develop polycentric transit systems that serve other economic centers as well as they now serve downtowns.

Click image to download a copy of this report.

The report scrutinizes transit systems in eight urban areas that have built or are planning to build rail transit lines. After adjusting for inflation, the costs of these lines has dramatically increased in recent years: Calgary light-rail construction costs quintupled from $53 million to $275 million per kilometer; Toronto subway costs have grown from $76 million to more than $1 billion per kilometer; and Edmonton, Vancouver, and other cities have seen similar increases. Continue reading

Silicon Valley Housing Plan

In December, I pointed out that Silicon Valley’s transit system was designed for the 1910s and suggested a way to redesign it so that it would serve a 2020s urban area. Last month, the Santa Clara Valley Transportation Authority (VTA) announced that is attempting the exact opposite strategy: it wants to turn Silicon Valley into a 1910s urban area.

Planned high-density developments aim to turn San Jose into a Greenwich Village lookalike. Source: Republic Urban Properties.

Last week, a Silicon Valley group called Opportunity Now published my assessment of why this strategy is bound to fail. Instead, it will waste a lot of tax dollars and enrich a few property developers without making the region’s housing more affordable or helping regional mobility.

Transit Carries 74% of 2019 Riders in January

Driving and flying have been hovering around 100 percent of pre-pandemic levels for the last year and Amtrak has been around 100 percent for the last six months, but transit is still stuck at just below 75 percent, according to monthly data released by the Federal Transit Administration yesterday. Transit first reached 73 percent last March and 74 percent in September, and even exceeded 75 percent in November (a month that had more business days in 2023 than 2019), but it doesn’t look like it will get significantly above 75 percent for a long time.

When measured as a percent of pre-pandemic travel, transit continues to lag well behind all other modes of travel. Highway data for January 2024 should be available soon. For more on Amtrak and air travel, see yesterday’s post.

The results vary by urban area, of course. Above-average areas include New York (80.5%), Miami (90.5%), Washington (80.6%), San Diego (80.6%), Tampa-St. Petersburg (83.4%), Las Vegas (83.6%), Cincinnati (96.7%), Austin (82.8%), and Richmond (113.1%). Remaining well below average are Chicago (62.6%), Atlanta (53.0%), Boston (62.0%), Detroit (54.7%), Phoenix (50.4%), San Francisco-Oakland (59.0%), St. Louis (58.6%), Pittsburgh (54.5%), and Jacksonville (56.9%). Continue reading