Paying People to Ride Transit

Denver urban planner Drew Willsey has what he thinks is a great idea: relieve traffic congestion by paying people to ride transit. He accepts, reluctantly, that the billions of dollars Denver’s Regional Transit District (RTD) has spent on rail transit hasn’t worked: transit’s share of commuting has dropped from 4.9 percent in 2000 to 4.6 percent in 2016, and, considering ridership is dropping, probably lower in 2017.

Unfortunately, like many other planners, Willsey can’t get the idea that transit is the solution to everything out of his head. He implicitly assumes that transit is good, cars are bad, and the most cost-effective way of relieving congestion is always by increasing transit.

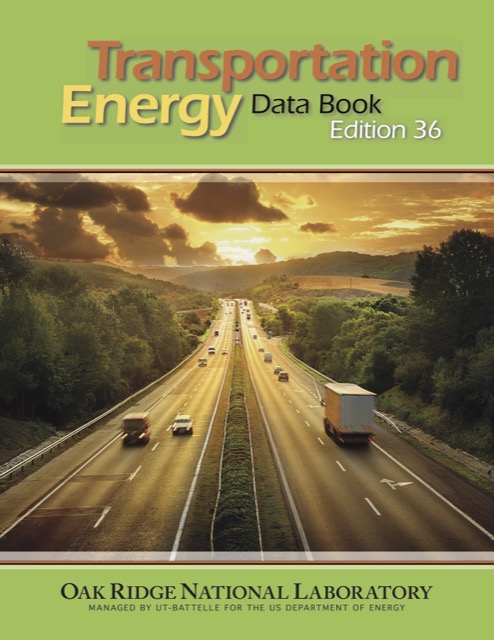
In Denver, at least, none of these assumptions are true. The Transportation Energy Data Book says that cars used about 3,000 BTUs and light trucks about 3,600 BTUs per passenger mile in 2015 (and probably slightly less in 2016). The National Transit Database says RTD used 3,800 BTUs per passenger mile in 2016. Cars emit about 212 grams of carbon dioxide per passenger mile, light trucks 268, and RTD 272. Certainly some cars and trucks are worse, but some are much better. Continue reading

Amtrak 2017 Report

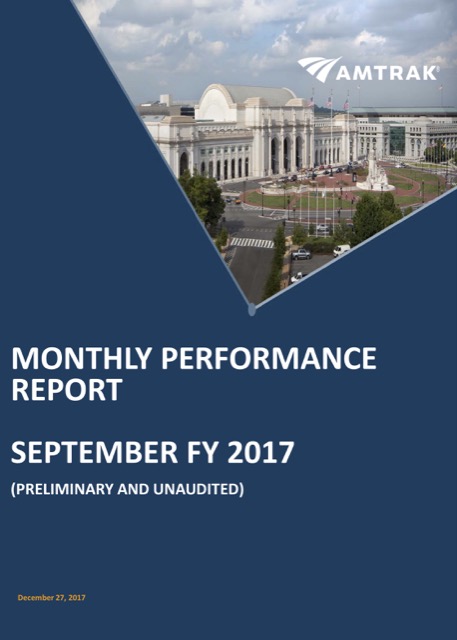
Amtrak recently posted its September 2017 Monthly Performance Report, which includes cumulative data for F.Y. 2017 as a whole. Unfortunately, with the September report, Amtrak changed the format of its monthly reports, reducing the size from 90-some pages (such as this one for 2016) to five. What is Amtrak trying to hide?

Unlike an annual report (which Amtrak hasn’t yet published for 2016), the monthly performance reports have data for each of 46 Amtrak routes. This includes the Northeast Corridor (broken down into Acela and “regional” trains), 29 state-supported day trains, and fifteen overnight or long-distance trains. The abbreviated train-by-train data in the new-format reports includes gross revenues, operating expenses, fare revenues, seat miles, and passenger miles. Continue reading

Leaked Trump Infrastructure Plan?

Someone claims to have obtained a leaked document relating to the mythical Trump infrastructure plan. The document is sketchy and contains no hard dollar figures, but it gives an idea of what might be in a final plan.

The document proposes seven different initiatives or programs. The largest, called the Infrastructure Incentives program, would get half of any appropriations to pay for up to 20 percent of the cost of “core infrastructure projects” including transport, water, power, superfund, and flood control projects. The document doesn’t seem to distinguish between new projects and rehabilitation of existing ones, so the politicians who seek the funds would probably be biased in favor of new. Projects would be rated on a variety of criteria the most important of which would be the ability of the state or local government to sustain financing for the project.

Rural infrastructure is the second-largest program, getting 25 percent of funding for transport, water, power, and broadband. The funds would be distributed as block grants rather than matching funds, based on each state’s population and rural road miles. Continue reading

Transportation Energy Costs

The average car on the road consumed 4,700 British thermal units (BTUs) per vehicle mile in 2015, which is almost a 50 percent reduction from 1973, when Americans drove some of the gas-guzzliest cars in history. The average light truck (meaning pick ups, full-sized vans, and SUVs) used about 6,250 BTUs per vehicle mile in 2015, which is also about half what it was in the early 1970s.

Click on the above image to download a 10.2-MB PDF of the above report. Use links below to download spreadsheets or individual chapters from the report.

By comparison, the average transit bus used 15 percent more BTUs per vehicle mile in 2015 than transit buses did in 1970. Since bus occupancies have declined, BTUs per passenger mile have risen by 63 percent since 1970. While buses once used only about half as much energy per passenger mile as cars, they now use about a third more. Continue reading

November 2017 Ridership Falls 1.9 Percent

Nationwide transit ridership in November 2017 was 1.9 percent lower than the same month in 2016, while ridership for the first eleven months of 2017 was 2.5 percent lower than the same period in 2016. If similar numbers are posted for December, then total annual ridership will have fallen below 10 billion trips for the first time since 2010.

These numbers are from the Federal Transit Administration’s November update to its National Transit Database. The update includes passenger trips, vehicle revenue miles, and vehicle revenue hours by month from January 2002 through November 2017, broken down by transit agency and mode. These numbers may be preliminary and might change slightly in later updates. These numbers are also for calendar years so will differ from the final 2017 report, which is based on each agency’s fiscal year. Continue reading

U.S. Infrastructure: Not about to Collapse

A recent report from the RAND Corporation looks at America’s infrastructure and concludes that “not everything is broken.” In face, what is broken, more than the infrastructure itself, is “our approach to funding and financing public works.” This is largely because governments by-pass market signals and rely on “often complicated and multilayered governance arrangements and competing public goals and preferences” to make decisions about where to spend money.

For example, the report shows that government spending on infrastructure as a percentage of gross domestic product declined from a peak of 3 percent of GDP in 1960 to about 2.5 percent in 1980, and has hovered between 2.5 and 2.7 percent since then. But governments also made a clear trade-off in infrastructure spending: spending on roads declined from 1.6 percent of GPD in 1960 to around 1 percent in and since 1980, while government spending on mass transit grew from 0.1 percent in 1970 to 0.4 percent in and since 1980.

This would be fine if spending on mass transit had been as productive as spending on highways had been. But it wasn’t. Until the 2008 financial crisis, per capita driving continued to grow despite the lack of much capital spending on new roads, while per capita transit ridership was stagnant or declining. The report doesn’t have data after 2014, when per capita driving began to increase again while transit ridership began to collapse. Continue reading

Metro’s Unsurprising Derailment

Washington Metro officials pretended to be shocked when a Red Line train derailed due to a broken rail on Monday. In fact, the break should not and probably didn’t surprise any of them.

“It’s like, God, didn’t we do all of the fixing, the bad areas, SafeTrack?” rambled Metro’s board chair, Jack Evans. “All that stuff was intended to prevent stuff like this from happening.” Actually, Evans knows perfectly well that the SafeTrack work was superficial and the system still needs $15 billion to $25 billion of maintenance and rehabilitation work.

“This rail was manufactured in 1993, which may sound old but actually rail can last 40, 50 years,” said Metro general manager Paul Wiedefeld, “so it’s not particularly old in the railroad business.” Actually, it is. Continue reading

Is Transit the Only Answer? Is It Even an Answer?

“Forget self-driving cars,” argues Rod Diridon, the former chair of one of the worst-managed transit agencies in the country. “Mass transit is the only answer to gridlock.” Writing in the San Jose Mercury-News, Diridon presents what he considers to be alarming statistics about job growth and then asserts that only huge subsidies to transit will allow those people to get to work.

“Well over 100,000 new primary jobs will be added to Silicon Valley in the next decade,” he estimates, and each primary job will be supported by seven to thirteen secondary jobs. Since Silicon Valley (which I equate to the San Jose urbanized area) only had 873,000 jobs in 2016, he is essentially predicting that jobs (and therefore population) will more than double in a decade. Considering that the region’s population has only been growing at about 1 percent per year, that’s impossible.

At no matter what rate the region is growing, transit–or at least the Santa Clara Valley Transit Authority (VTA) that Diridon once led–has proven itself incapable of dealing with this growth. Back in 2000, VTA carried 55.6 million transit riders. By 2016, the region’s population had grown 16 percent, yet ridership was down to 44.0 million. In the first ten months of 2017, ridership fell another 8.5 percent below the same period in 2016. As a result, annual transit trips per capita have fallen by more than a third since 2000. Continue reading

Brightline Opens to Tragedy

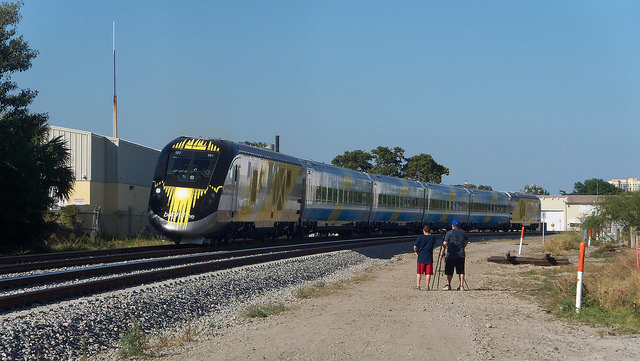
Brightline passenger trains began operating between Fort Lauderdale and West Palm Beach on Saturday, just one day after a VIP preview run killed a pedestrian. This was an inauspicious beginning for what is supposed to be the first new private intercity rail service in the United States in at least four decades.

The first test run of Brightline equipment took place nearly a year ago on January 18, 2017. Flickr photo by BBT609.

The fatality took place when a woman walked around the crossing gates that had lowered in advance of the train. Hers was the third death resulting from the trains before they collected a single revenue fare. One of them was ruled a suicide, but even it might have been prevented if Brightline had fenced its right of way. Brightline says it has implemented positive train control, but positive train control cannot prevent pedestrian or grade-crossing accidents. Continue reading

Expressing Opposition After It Is Too Late

Perhaps encouraged by the Trump administration’s opposition to wasteful transit projects, it has now become popular for politicians to come out in opposition to those projects when it is clear they are boondoggles. Some of them, however, are expressing their opposition only after it is too late to stop the projects.

For example, Broward County wants to build an inane streetcar line in downtown Fort Lauderdale. Someone twisted Secretary of Transportation Chao’s arm to actually provide federal funding for the project. But when bids were opened to build it, they came in much higher than projected.

Now, all three candidates to be the next mayor of Fort Lauderdale say they oppose the streetcar. But the decision to build is in the hands of the county commission, not the city council, and the county is going to have another bid process. So it is safe for the mayor and council candidates to oppose something they can’t actually stop. Continue reading