Each year, the Texas Transportation Institute publishes a report on congestion in America. In 1999, the anti-auto Surface Transportation Policy Project followed the Texas congestion report with a report of its own claiming that sprawl causes congestion.[1] "As growth sprawls outward, jobs, housing, and services grow farther apart," says the report. Such sprawl, claims the report, is "a primary cause of congestion." The report claims to be based on a "rigorous analysis" of Texas Transportation Institute data--an analysis not included with the report. Instead, the report's logic goes like this:
Rather than use Texas Transportation Institute data, the Policy Project refers to a 1992 report by Alan Pisarski that estimates that increases in driving are due to the causes shown in table four. "As much as 69% of the growth in driving between 1983 and 1990 was caused by factors influenced by sprawl," says the Policy Project. "These factors include the same people driving farther, as well as a decrease in carpooling and a switch from bicycling, walking or transit to driving."[2]
Increase in population                   13%
Increase in trips taken                  18%
Increase in trip lengths                 35%
Decrease in passenger per vehicle        17%
Switch from other modes to driving       17%
Total                                   100%
Source: Alan Pisarski, Travel Behavior Issues in the 90's (Washington, DC: FHwA, 1992), p. 14. The last three items are factors that the Surface Transportation Policy Project says are "influenced by sprawl."
In fact, all of the changes that the Policy Project blames on sprawl are really due to other factors. The reduction in passengers per vehicle (which the Policy Project calls carpooling even though most multi-passenger vehicles are on family business, not commuting) is due to the reduction in household sizes. Between 1983 and 1990, average household size fell from 2.80 to 2.63 people per household--a 5.8 percent drop.[3] In that same period, average vehicle occupancy fell from 1.75 to 1.64 people per vehicle--a 6.3 percent drop.[4] This suggests that more than 90 percent of the decrease in vehicle occupancy is due to shrinking family sizes. "Primarily," agrees Pisarski, reductions in occupancy "are a product of decreasing family size and increasing vehicle availability," which means increasing incomes.[5]
The switch from other modes to driving is also due to rising incomes making cars available to more people. This switch is found in dense, transit-oriented cities such as New York and San Francisco as much as in the suburbs, indicating it is not a sprawl-related phenomenon. According to Pisarski, 56 percent of the decline in transit usage was in central cities, while only 41 percent was in the suburbs.[6] The largest declines in transit usage were in the transit-intensive Northeastern cities.[7]
The increase in trip lengths may be partly influenced by low-density suburbanization, but not in the way the Policy Project implies. Instead of being due to "jobs, housing, and services growing farther apart," it is a response to the lower congestion found in low-density areas. Lower congestion means that people can live in a desirable area further from work without taking more time to commute. Lower congestion means that, instead of shopping at an expensive grocery store a half mile away, people can drive five miles to a superwarehouse store and save far more than the dollar or so it costs them to drive the extra distance. Increasing trip lengths are more due to increases in income than to suburbanization. Pisarski observes that "both central city and suburban trip lengths have shifted toward longer trips."[8] A major component of increasing trip length is among women, whether urban or suburban. The growth in women's travel in the 1980s and 1990s have "clearly . . . affected the overall growth in passenger miles of travel" says Pisarski.
What about the Policy Project's "rigorous analysis" of Texas Transportation Institute data? The report invites readers to "contact STPP for detailed methodology" for more information about this analysis. When contacted, the Policy Project sent a three-paragraph "blurb" (their description) describing the analysis but including no data and few results.[9] The analysis supposedly used Texas Transportation Institute data to compare congestion with changes in population densities between 1992 and 1997. But--for 1992 only--it used a different set of population densities from those calculated by the Texas Transportation Institute.
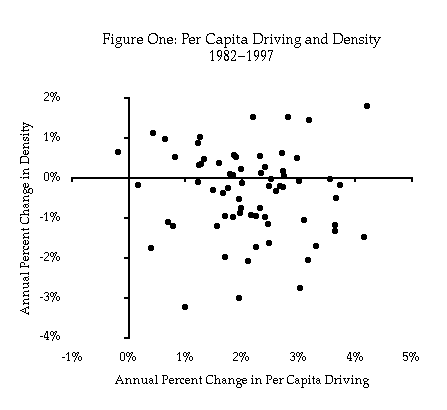
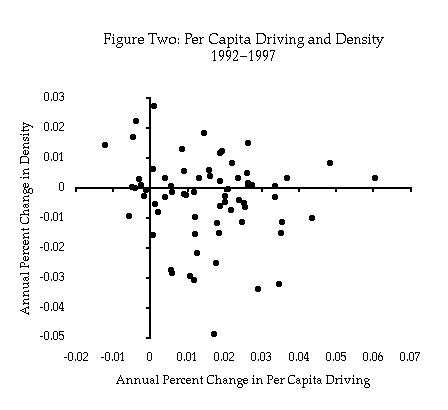
Replicating what the project says it did using Texas Transportation Institute data reveals that changes in density are totally unrelated to changes in driving. If sprawl increased driving, then decreased densities should correlate with increased per capita driving. Yet, as shown in figures one and two, there is no correlation whether comparing 1992 and 1997 data or the longer (and thus more valid) period between 1982 and 1997.[10] Other factors, such as income and family size, must influence driving far more than density. Why is this conclusion so different from the Policy Project's unpublished analysis? The answer must be that the densities that the project substituted for 1992 returned misleading results.

Source: Texas Transportation Institute data for each urban area, available at http://mobility.tamu.edu/study/usmap.stm. Slope is minus 0.059, meaning a 100 percent increase in density could reduce driving by 5.9 percent. But the r-squared is only 0.005, which indicates that the relationship is no better than random.

Source: Texas Transportation Institute data for each urban area, available at http://mobility.tamu.edu/study/usmap.stm. Slope is minus 0.134, meaning a 100 percent increase in density could reduce driving by only 13.4 percent. But the r-squared is only 0.017, which is still no better than random.
"The traffic consequences of suburbanization are benign," say University of Southern California planning professors Peter Gordon and Harry Richardson. In fact, they add, "suburbanization has been the dominant and successful mechanism for coping with congestion."[11] Low-density suburbs are a major solution to, not a cause of, congestion.
1. Surface Transportation Policy Project, "Why Are the Roads So Congested?" (Washington, DC: STPP, 1999), 8 pp.
3. Census Bureau, Intercensal Estimates of Total Households by State, www.census.gov/population/estimates/housing/sthuhh7.txt.
4. Patricia Hu and Jennifer Young, Draft Summary of Travel Trends: 1995 Nationwide Personal Transportation Survey (Oak Ridge, TN: US DOE, 1999), table 15.
5. Alan Pisarski, Travel Behavior Issues in the 90's (Washington, DC: FHwA, 1992), p. 12.
9. Reed Ewing, personal communication, March 8, 2000.
10. Texas Transportation Institute data for each urban area are available at http://mobility.tamu.edu/study/usmap.stm.
11. Peter Gordon and Harry Richardson, "Congestion Trends in Metropolitan Areas," in National Research Council, Curbing Gridlock: Peak-Period Fees to Relieve Traffic Congestion (Washington, DC: National Acadamy Press, 1994), volume 2:1-31.