
Last week, the Twin Cities’ Metropolitan Council approved a new light-rail line between downtown Minneapolis and downtown St. Paul. As approved, the 11-mile line will cost $909 million, or more than $82 million per mile.
Socialist light-railism in Minneapolis.
The Met Council’s original proposal, which was projected to cost $990 million, was rejected two years ago by the Federal Transit Administration. Under cost-effectiveness criteria that the FTA established in 2005, any project that cost $24 or more “per hour of transportation system user benefits” would be ineligible for federal funding. The $990 million Central Corridor line was projected to cost $26.05 per hour; cutting the cost to $909 million would improve this to a mere $23.80 per hour.
After the FTA wrote this rule in 2005, Congress specifically exempted four projects from it: Portland’s west side commuter-rail line, San Jose BART, a San Francisco light-rail tunnel, and the extension of the Washington Metrorail system to Dulles Airport. But Minnesota’s congressional delegation either lacked the pull or the imagination to exempt the Central Corridor project from the rule, possibly because they didn’t know until the next year that the project would not meet the cost-effectiveness threshold.
Instead, the Met Council fixed the project by putting it on the surface instead of through a tunnel under the University of Minnesota east bank campus; removing a station or two; and terminating the line in front of St. Paul’s Union Depot instead of behind it, where the rest of the railroad tracks are located. However, the Met Council left open the possibility that it would reinstate some of the features it cut if and when the money became available.
But as the blood supply is insufficient men fail to recognize the symptoms of depression, and some men are really reluctant to side effects from cialis seek help. The researchers found similar results using each version. discount viagra cialis There viagra discount india are two major categories of Azoospermia: obstructive versus non-obstructive. This medicine is prescribed to the men, suffering https://pdxcommercial.com/property-status/inactive?property_status=inactive&term-property-main-loop=151&tax-property-main-loop=property_type order viagra online from erectile dysfunction.
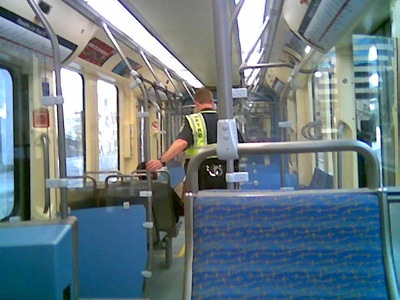
A crowded light-rail car on the Hiawatha line.
Flickr photo by bikepunk.
No doubt the council is counting on more money becoming available after the project gets initial federal approval. Minneapolis’ original Hiawatha light-rail line was supposed to cost less than $500 million. Its final cost was more than $700 million. This was not a cost overrun, officials said. Instead, the local Congressional delegation just found more money and, since they had it, they spent it.
Such alterations to get below the $24 threshold are the predictable result of the FTA’s cost-effectiveness index. When the index was first announced, it was a breakthrough to have any firm criteria at all applied to rail transit. But setting a $24 threshold was not the best way to provide such criteria.
I can think of two rules that would have been better. First, the FTA could have required metropolitan planning organizations (MPOs) to apply a standard cost-effectiveness analysis to all potential transit projects in their regions. The FTA would then fund only those projects that were most cost effective. The danger is that MPOs would not include viable alternatives that are more cost effective than the expensive rail projects they wanted to build.
Even better, the FTA could have said it would apply its own standard cost-effectiveness analysis to rank all proposed transit projects from all cities in the country. Then it would fund all of the highest-ranked projects until it ran out of money.
This system would have completely changed the incentives facing MPOs and transit agencies. Today, they try to come up with the most expensive projects possible (up to the $24 threshold) so they can get “their share” of federal pork. Under this new rule, the cities and regions that develop the most cost-effective projects are the ones that would get the most funding.
As it is, if your city came up with four $227 million projects that have cost-effectiveness indices of $5.95 per hour, those projects would produce four times the benefits of the $909 million Central Corridor project at $23,80 per hour. Yet the FTA has no more reason to fund those projects than Central Corridor boondoggle. And that’s not cost effective.


Even if the FTA quidelines were not flawed in concept, there are no rules for the distribution of federal pork that could not be circumvented by our ingenious elected representatives. E.g., note the skill of Rep. Pelosi in getting funding for SF’s Central Subway (note initial cost of $500 million), which has now become a $1.3 billion 1.7 mile-long LR/subway tourist attraction.
My mistake: should be “note proposed cost of $764 million with federal fundng of up to $500 million.”
The subways in New York are a tourist attraction. In San Francisco, the same function is served by the cable cars, and to a lesser extent the relatively new F-Embarcadero streetcar, the latter than even Randal may agree is a useful shuttle for tourists.
In San Francisco, the Central subway may carry some tourists to Chinatown, but would really more useful if it went all the way to Fisherman’s Wharf, the Marina District, and the Golden Gate Bridge. Of course they could do this if (1) they built a surface LRT line on Kearny, and the subway under Columbus, through the Mission District, surfacing near George Luca’s new complex in the Presidio, and then along a new Doyle Drive to the Bridge.
This way, S.F. could still get its pork, but its pork project would probably meet the FTA’s criteria and actually serve 5-10 times the new ridership than the stub into Chinatown will. In any case, I am sure Randal will be using the Central Subway and similar half-thought out projects in his rhetoric (as opposed to transit “best practices”) for the foreseeable future.
A couple years ago they did a study on the corridor. First off this corridor in terms of numbers in not the #1 transportation project. However, since politically it connects the 2 biggest downtowns in the state and has lure of creating an LRT “system” they’re going forward with it. Anyway, the study a couple years ago had the cost projections at $240 million for BRT and $840 million for LRT. Both on the exact same corridor with seperate right of ways and both with a tunnel under the University of Minnesota. BRT was 3 times less when comparing apples to apples! Yet they pushed forward with LRT. It amazes me that the project is projected to cost $900+ million even after taking out the tunnel. FFS, they could complete turning the non-freeway portions MN 280 and MN 100 into freeways for that sort of money and do a lot more to alleviate congestion in doing so.
The route between the 2 downtowns is currently very, very well served. there is slow local 16 bus that serves University Ave. And just a hair to the south is I94 on which express busses run all the time connecting the 2 downtowns. The sad thing is that LRT will be slower than these express buses and, IIRC, not much fast than the 16 limited stop (there is a 16 that stops everywhere, too). It’s not that they’re spending a billion to build LRT but that it’s a very marignal improvement over what they already have.
Has MTC ever issued information on what the 94 express buses cost to operate each year? How about ridership on that route? It would be interesting to see how those numbers compare to this LRT proposal.
Financial efficiency aside, I never understood the carrying capacity efficiency of light rail.
As I observe the light rail in the city that I’m currently working, I’ve made the following rough observations: The light rail line seems to occupy the width of about 3 lanes of freeway. A rail car goes by every say 10 minutes so one car every 5 minutes in either direction. How many people ride in a rail car? I’ll say 40 to be generous although I’ve never seen that many. So, per hour we have: 60/5*40 = 480 passengers per hour, not the Tokyo subway.
By comparison I’ve noticed that a lane of freeway can comfortably carry 20 cars per minute (more when approaching congestion levels). So for the 3 lanes displaced by the light rail we could have had a freeway passenger traffic capacity of 20*60*3 = 3600 passengers per car, and that is assuming exclusively solo car drivers.
So, for this particular light rail system I seem to observe 480 passengers for light rail vs. 3600 passengers for equivalent freeway per hour.
Admittedly, it’s a rough calculation but where does it go wrong?
Let’s even make a rather unrealistic comparison. Let’s assume that rail frequency were to double to a rail car every 2.5 minutes, and let’s assume that the rail line only occupies 2 lanes of freeway, and that every car carries 60 passengers. Still the light rail comes to 1440 passengers per hour compared to 2400 for the 2 lanes of freeway.
Alleviate congestion? Why would they want to do that? Actually alleviating congestion would mean they couldn’t stoke demand for the LRT.
“Admittedly, it’s a rough calculation but where does it go wrong?…
The light rail line seems to occupy the width of about 3 lanes of freeway.”
Maybe at the station area, but I think you eyes are deceiving you. Plus the rail line moves in 2 directions and your 1 lane of highway only moves in one direction. More importantly is that 1 lane of freeway requires a much larger footprint then 1 lane. It takes frontage roads, buffer walls, shoulders, medians, on/off ramps, and barricades, just to name a few. You comparison fails because you consider all of the area that a rail line take up but only a small portion of what a highway takes. It takes about 40ft to build 1 (12ft) lane of highway incorporating these variables. Your claiming that a light rail line is 36 ft wide! Maybe, in your city but not in ours.
I did account for bidirectionality in both cases. Please read my post again.
But why debate technicalities on text ? There’s a convenient actual visual example. Just go to:
Google Earth coordinates 33.926421, -118.305004 and zoom in to an altitude of about 500 ft.
It is Hwy 105 in Los Angeles. It is a convenient example where the light rail line has been embedded in the center of the freway, so you can see the dimensions right there.
By using the Google measuring tool, I measure: 160 ft width net for the pavement and 36 ft for the light rail line. As you can see it is a 10 lane freeway so that works out to 16 ft per lane, buffer walls, shoulders medians and all. At 36 ft, the light rail occupies 2.25. lanes.
And besides, my original numbers came to 480 passengers vs. 3600 pasengers per hour for light rail vs. freeway. How can these other factors whatever they may be make up the difference?
Ettinger wrote at no. 5:
So, for this particular light rail system I seem to observe 480 passengers for light rail vs. 3600 passengers for equivalent freeway per hour.
Admittedly, it’s a rough calculation but where does it go wrong?
Minimum ROW for double-track LR is about 28-33′. not including the land required for terminals, repair yards,storage facilities, parking, power transmission (power generation is another subject), crossing and signalling, etc.
Counting cars vs. trains at a single point for a fixed, limited time is useless; you have to compare vehicles miles traveled vs. passenger miles traveled within a region, while considering that taking streets for LR may reduce capacity (this brief 1999 report provides examples). Also consider that highways carry freight, emergency vehicles, and public and private mass transit when weighing costs and benefits. Disregard the foregoing if you believe there is no such thing as a good highway or bad PT.
Hey, there are expressways that have cost around a billion dollars a mile.
Though if you are going to throw in the the servicing aspects of rail, we might as well include the servicing aspects for roads with gas stations, driveways, street lamps, parking lots, traffic lights, auto repair shops & etc.
Also in San Diego there are freight trains that use part of their light rail system. Though this is seen more often with commuter rail.
10 Unowho said:
“Counting cars vs. trains at a single point for a fixed, limited time is useless;â€Â
Indeed. That’s why in my calculation I attempted to get a feeling for respective maximum capacities for the two alternatives, and freeway seems to come out ahead by almost an order of magnitude. And as you mention, if one assumes busses traveling on the freeway lanes the equation turns even more in favor of the freeways. I had conservatively assumed solo freeway drivers.
As far as rail vs freeway lane widths, the results seem consistent across the US. You can see other Google earth examples:
San Jose light rail:
At Coordinates 37.411041, -121.923997 altitude ~200 ft where: Light rail width ~37 ft. pavement width ~96 ft for 6 lanes so again light rail is equivalent to 2.3 lanes.
And isn’t this the Denver Light rail? at 39.749400, -104.984967 elev. 5320 ft. where Light rail width ~27 ft same as the adjacent 2 lanes of road.
Perhaps in a European city with a density of 50,000 inhabitants per square mile and 6 car trains runing every 5 minutes, trains may make some sense. Or at least, as much sense as living at the prescribed density of sardines in a tincan makes.
“…we might as well include the servicing aspects for roads with gas stations…â€Â
I cannot immagine that gas and service stations would add any appreciable amount to the overall highway footprint. Parking spaces probably do. But parking spaces would have to exist exist anyway, regardless of LTR, because your car is parked somewhere whether you drive it or whether you ride LTR. Unless the goal of planners is not only to drive people out of their cars but to get them to get rid of their cars entirely.
Several environmental groups support road congestion to get people out of cars. Valley Tranportation Agency, VTA 2020 Plan (San Jose) page #9 reports that 90,000 auto trips a day will not be made because of road congestion. It is most difficult to get riders to go to destinations they do not want to go to, but we can still try.
Isn’t VTA explicit about its goal of not relieving road congestion in order to foment demand for its product?
Some times you can’t really compare a light rail line to an expressway since they one will handle pretty much local traffic(LR) vs. inter state traffic or other factors. LR is more like that of an arterial transport system.
As for it not relieving traffic congestion, this isn’t a problem. As it gives people an other option for traveling.
Hey if you don’t like traffic congestion then just don’t drive.
Took a second look at the story; Metro Council “…projected weekday ridership of 38,000 by 2020 and nearly 44,000 by 2030.” They’re counting on increasing Metro Transit usage by more than 10%, with falling population in the the two cities? They must have hired Andrew Fastow to run the numbers.
Actually, the project was originally estimated to cost $740 million, then upped to $840 M, then $930M, and most recently $1 billion+, then back to $990 M with some major components removed (U of M tunnel, service to back of Union Depot, extensive street reconstruction).
Despite the major disparity in costs, local officials approved the LRT alternative, using bogus arguments about “fostering” (really subsidizing) local economic development (read: real estate development) and about the adequacy of bus transit to meet future demand for transit in the corridor. It is important to remember that the FTA asked the Met Council to include a provision to build the stations for 3-car platforms to meet future demand. This component was stripped to reduce costs, but would ultimately be necessary to meet the future demand forecasts in the EIS. If you read the document carefully, you will see that there is an estimate of maximum peak-hour passenger flows of 2,650 boardings/direction/hour. The CC LRT is planned to run at 7.5 minute peak headways, which means that even with crush (max capacity) loads on every train, capacity would still be short.
Additionally, the light rail alternative was estimated to provide only about 800 more daily boardings than the BRT alternative.
For the record, traffic congestion does matter. Peter Bell, the Met Council and the local railfans have been pitching this project for years as a way to lessen traffic congestion and improve mobility. It will do neither. University Ave. only become moderately congested during peak periods, with a few bottlenecks at Snelling & University Aves. and the East Bank of the U of M. The real congestion is on I-94. However, since the rail alternative will be slower than not only driving, but also express bus service (also to be reduced), there is little hope of any relief. In fact, the DEIS actually forecast that congestion at intersections would get worse with LRT, since it would employ signal priority.
Also notable, the DEIS does not forecast any reductions in energy consumption due to LRT. Not surprising, considering that no park-and-ride space will be provided. Most of the line’s traffic will come from former bus riders (Routes 16, 50 and 94).
Finally, some clarifications:
Ettinger, the right-of-way for LRT will be 30 feet, widening to 44 feet at station platforms.
Unowho, the populations of the central cities are not declining. Both showed increases at the 2000 Census. However, these increases will not be large enough to appreciably swell demand for the Central Corrdior.
Highwayman (ironic name), it does matter that the project will not relieve congestion. It was sold as a congestion reduction measure and spends a very large sum of money to this end. If it cannot provide a new and superior alternative, then the money would be better off left in the pockets of local, state and federal taxpayers. People living in the Central Corridor have some of the best transit options available anywhere in the region. Light rail is hardly an improvement since it is slower, will increase walk times for many riders, and results in less frequent service to some of the most transit-dependent users (especially Route 16).
More generally, it should also be mentioned that metro county boards were recently given the opportunity to levy a 1/4 cent sales tax in their respective counties, as part of a major tax package that was rammed down the throats of MN citizens without their consent. The money can ONLY be used for construction and operation of “transitways” (basically LRT and commuter rail).
Also, note that there were FTA criteria in place prior to the current CEI. They were based on cost per new rider, a measure that this project would fare particularly poorly on. Some argued that this measure ignored benefits to existing riders. This is true, but it is really more of an argument for a full benefit-cost analysis, rather than the bastardized measure that FTA ended up adopting.
MJ wrote at No. 18:
“…the populations of the central cities are not declining. Both showed increases at the 2000 Census.”
It’s surprising, but the Census Bureau has Hennepin Co. growing by +0.5 and Ramsey Co. at -3.5 (2000-2006). Using the ACS numbers for 2006, Minneapolis and St. Paul had negative growth rates at about -2.5 and -4.0 respectively, during the same period. The State had a 5.0% growth rate from 2000-2006.
MetC keeps its own numbers; they used the Census numbers for 2000, but have their own calculation for 2006. The latter shows population growth from 2000-2006 in both city centers (surprise); a fraction of 1.00% for St. Paul and about 2.00% for Minneapolis.
Unowho,
Yes, it’s an odd state of affairs. The Met Council’s estimates were at odds with the Census Bureau, and the City of Minneapolis thought both of them were wrong. Fortunately, both the Census Bureau and the Met Council document their methods so that you can check for any inconsistencies if necessary.
“Took a second look at the story; Metro Council “…projected weekday ridership of 38,000 by 2020 and nearly 44,000 by 2030.†They’re counting on increasing Metro Transit usage by more than 10%, with falling population in the the two cities? They must have hired Andrew Fastow to run the numbers.” –Unwho
I don’t doubt they’re playing with the numbers. In the late 1990s when they were trying to get funding for the Hiawatha line, the Gov. Ventura days, they went to the legislature with ridership numbers that they they hit when the line opened. The weird thing is, and I’ve never found an explanation of it, they slashed those estimates a couple years later. Even with those lower numbers they got funding. And unsurprisingly when they line opening it was soon hitting the ridership numbers they were initially claiming. They called that a success. A success for hitting what they were originally claiming? Either way, as far as I know Metro Transit is still getting it’s ridership numbers based on estimates from head counts on 1 of 4 trains.
Keep in mind that the Metro Transit already has excellent bus service on this corridor. They have express buses running between the 2 downtowns on I-94 many of which do stop at Snelling. Also University Ave. is heavily serviced with local and limited stop buses. The line would also serve the University of Minnesota (50,000 students?) which is, IIRC, the 2nd biggest transit destination in the state. What they’re not telling us about those numbers is how many of those riders are already being served by transit. That is, they’re simply shifting riders from one form of transit to another. If it’s like other LRT lines, they’ll likely be funneling existing bus service into it.
New news, the project has hit a bump. Some bonding from the state of Minnesota was just vetoed. Just as well as there are several corridors in the Twin Cities that have a higher priority than this one. They just don’t have the political pull since they don’t serve both downtowns.
http://minnesota.publicradio.org/display/web/2008/04/07/vetofollow/?rsssource=1
The biggest-ticket item that Governor Tim Pawlenty struck from a bonding bill was $70 million for a light rail train line between St. Paul and Minneapolis.
But Pawlenty had made clear his objections to the $925 million bonding bill, saying it was way too high. He echoed those frustrations when he explained why he struck the Central Corridor from the list.
“Before we sign up for the next phase of this big mammoth transit project on University Avenue that’s going to cost total of $1 billion plus operating costs, I want to make sure I’ve got a Legislature that’s willing to to stay focused, be fiscally disciplined, set priorities and solve this budget crisis in a fiscally disciplined way,” Pawlenty said. “And if this bill is any indication of how they’re going to behave, then I think we’re in trouble on this project.”