SF Muni Tries Washington Monument Strategy

Like many transit agencies, San Francisco Municipal Transportation Agency (Muni) is facing a big budget deficit, and its response is to employ the Washington Monument Strategy. For those who don’t know, back in 1969 President Nixon tried to reduce the National Park Service’s budget and the Park Service responded by shutting down the Washington Monument. Tourists who wanted to ride the elevator to the top of the monument were directed to the senate and house office buildings and told to ask their elected representatives to restore the agency’s budget. Congress restored the funding, but Nixon fired the Park Service director who thought up the strategy a few years later.

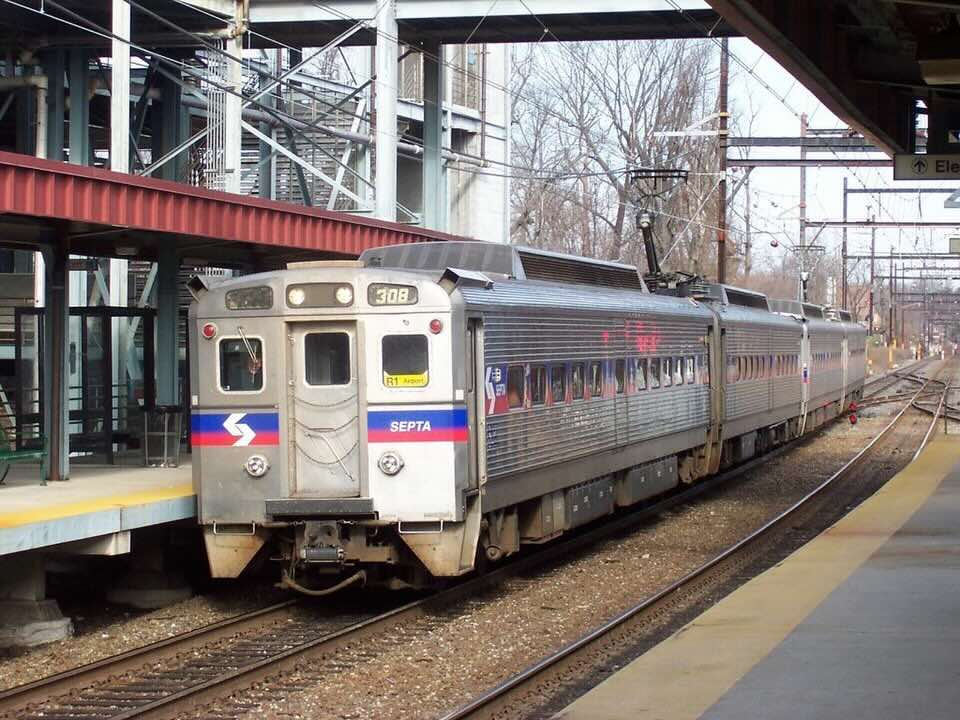
Photo by Pi.1415926535.

We may need to rename this the Cable Car Strategy, as Muni is proposing to reduce its deficit by suspending service on the cable car routes as well as some streetcar routes that are mainly used by tourists. While it’s true that cable car ridership has been slow to recover from the pandemic — as of September, it was less than 69 percent of 2019 numbers — it’s also true that cable cars are the symbol of the city and an important tourist attraction. Considering all the bad publicity San Francisco has received lately, its commercial interests don’t want to do anything to depress tourism still further. Continue reading

September Transit Ridership 76.3% of 2019

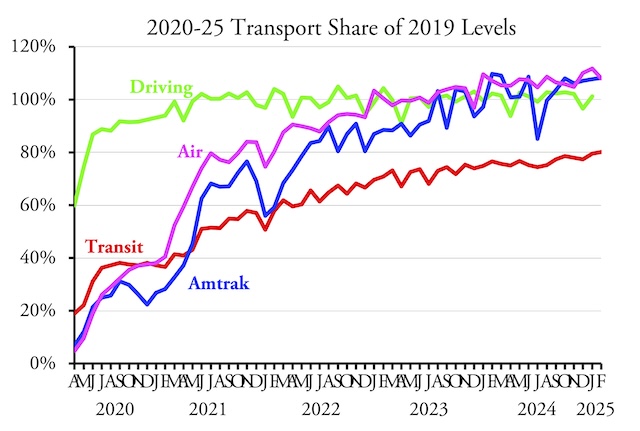
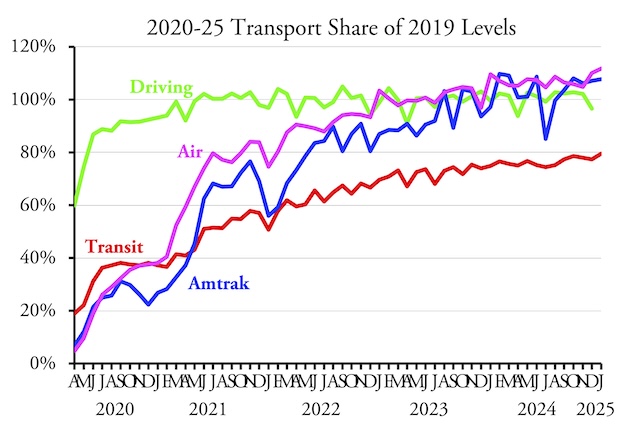
Transit agencies carried 76.3 percent as many riders in September of 2024 as they did in the same month in 2019, according to data released yesterday by the Federal Transit Administration. This is transit’s best performance, when measured as a share of pre-pandemic numbers, since the pandemic began.

Highway and Amtrak results for September will be posted here when it becomes available.

Highway travel had fully recovered from the pandemic by around July 2021. Air travel, which the Transportation Security Administration says carried 108.7 percent as many travelers as in September 2019, had recovered by January 2023 and Amtrak by October 2023. In October 2023, transit ridership still hadn’t reached 75 percent of pre-pandemic numbers, but that is probably the best it was going to do. Some of the growth in transit since then is due to some people returning to downtown offices, but much of that growth is probably more attributable to regular growth, not to recovery from the pandemic. Continue reading

Lower Fares, Higher Operating Costs

Transit agencies carried 18 percent more riders in 2023 than 2022, but 29 percent fewer than in 2019. Average trip lengths declined from 5.5 miles in 2019 to 5.0 miles in 2023, probably because commuter rail and commuter buses, which tend to carry riders the longest distances, did particularly poorly. Overall transit carried 35 percent fewer passenger-miles in 2023 than in 2019. These data are based on the National Transit Database and in particular the 2023 database that the Federal Transit Administration released last week.

A bus-rapid transit line has generated lots of positive publicity for Cleveland transit, but the truth is that Cleveland has one of the worst-performing transit systems in the country, with ridership falling 35 percent between 2014 and 2019 and another 30 percent between 2019 and 2023. Photo by GoddardRocket.

Fares were proportional to passenger-miles being 35 percent less than in 2019, while operating costs were 22 percent greater. The result was that the operating subsidy per rider, at $7.26, was more than twice 2019’s, which was $3.51 and only a slight improvement over 2022’s operating subsidy of $7.59 per rider. Operating subsidies per passenger-mile grew from 64¢ in 2019 to $1.51 in 2022, declining only slightly to $1.45 in 2023. Continue reading

August Transit Ridership 74.5% of 2019

America’s transit systems carried 25.5 percent fewer riders in August of 2024 as in the same month of 2019, according to data released by the Federal Transit Administration last Friday. Transit ridership has hovered around 75 percent of pre-pandemic levels since November 2023.

I previously reported that July transit ridership was only 71.1 percent of 2019, but warned that several major transit agencies had not yet submitted July numbers. Those agencies, I estimated, made up about 2.5 percent of U.S. transit ridership so I guessed that the real number would be 73.6 percent. I was off by a bit: all major agencies have report July numbers and July ridership was 73.9 percent of 2019. Continue reading

July Transit Ridership 71.1% of 2019

I’m back from Japan and mostly recovered from jet lag. I may write about my Japan experiences next week but first it’s time to look closely at the July transit data posted by the Federal Transit Administration the day I left the states.

Based on a quickie analysis on my iPhone I previously reported that transit carried only about 64 percent as many riders in July of 2024 as the same month of 2019. However, I warned that I wasn’t certain about this as I was having trouble analyzing a 15 megabyte spreadsheet on the phone. In fact, the number is 71.1 percent, which is better than 64 percent but worse than any month since July 2023. Continue reading

Transit Trouble in Kansas City

Kansas City is one of the few urban areas to see ridership recover from the pandemic. Recent transit data shows that the region’s transit carried 99 percent as many riders in the first half of 2024 as the same months in 2019, albeit mainly because it has reduced fares to zero. However, all is not well with transit in the self-described Paris of the Plains.

The Kansas City streetcar is a great success if you ignore the fact that it has never earned a single penny in fare revenues. Similarly, KC’s bus system’s recovery from the pandemic is less impressive considering it isn’t earning any fares either. Photo by Jazz Guy.

Earlier this week, the Blue Springs city council voted to end support to the Kansas City Area Transportation Authority (KCATA). The suburb of about 58,000 residents had paid the transit agency $73,000 for transit services in 2022-2023, but the agency had increased its requirement to nearly $123,000 for 2024-2025 “without much justification for the increase,” the city said. Continue reading

$553 Million a Mile for Elevated Rail

The Honolulu Authority for High-Cost, Low-Capacity Transit (HART) has signed a contract with Tutor Perini to spend $1.66 billion to build 3 miles of elevated rail line. The company will also build six stations on that rail line. This is the biggest contract for the Honolulu rail project let to date, but as expensive as it is, this doesn’t include all of the costs of planning, engineering, and design of the line.

As recently as a year ago, this segment of the project was expected to cost around $1.1 billion, and at least some people believed that the transit agency would have to reject all bids if they came in much higher than that as it simply doesn’t have the funds to complete the project. A previous bid of $2.0 billion by the same company was rejected in 2020, but HART apparently decided it could afford $340 million less than that amount even though it was about $400 million more than expected. Continue reading

Don’t Rearrange Deck Chairs When Ship Is Sinking

Denver’s Regional Transit District (RTD) has been slower than average to recover from the pandemic, carrying only 59 percent of pre-pandemic riders in June compared with an industry-wide average of 75 percent. Key legislators want to fix this problem by reforming how the agency’s board of directors is selected. Instead of letting voters select board members, they want to have them appointed.

Click image to download a PDF of this commentary.

This is equivalent to rearranging the deck chairs when the ship is sinking, charged an opinion piece in yesterday’s Denver Gazette. The article points out that RTD’s real problem is its downtown-centric route map. Prior to the pandemic, transit carried 22 percent of downtown Denver employees to work but only 2.6 percent of workers in the rest of the urban area. Continue reading

Dallas Revolt Against Transit Taxes

As of June, the Dallas Area not-so-Rapid Transit (DART) was carrying 80 percent of pre-pandemic riders, a little more than the national average of 75 percent. The decrease in ridership has minimal effect on its budget, since in 2019 fares covered less than 12 percent of operating costs. Still, officials of several cities in the region whose taxpayers are supporting DART are beginning to wonder why they are spending so much money and getting so little.

DART has spent more than $5.5 billion ($8.0 billion in today’s dollars) in capital costs building a light-rail system that has done very little for the region’s transit ridership. Photo by Jeffrey Beall.

DART is primarily funded out of a 1 percent sales tax levied on residents of 13 cities served by the agency. Since early July, the city councils of six of those cities have voted to reduce the sales tax going to DART by 25 percent, and the city councils of Dallas and at least one other city are considering similar resolutions. The tax is levied by DART, not the cities, so the votes are more symbolic of general dissatisfaction with how DART is run. To actually reduce the tax, the DART board would have to put a measure on the ballot and residents of each of the 13 cities would decide. Continue reading