Is Bicycling Improving?

One of my many beefs with government planning advocates is that they tend to judge success by measuring inputs rather than outputs. A case in point is a group that calls itself People for Bikes that issued a report last week that claims that Bicycling Is Improving in Cities Across the U.S.

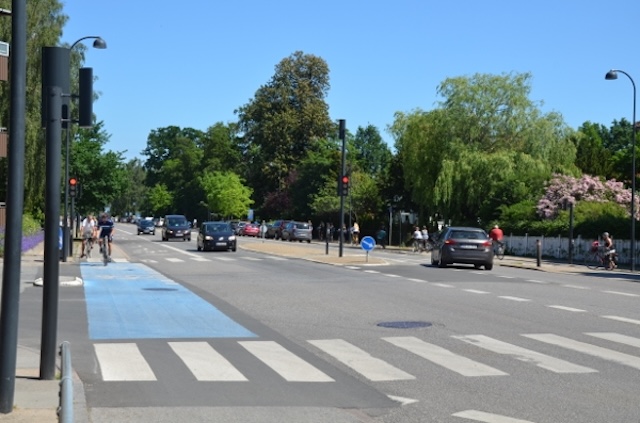
New bike lanes, but are they really safe?

Does it measure that improvement by the number of people cycling in those cities? Or by a reduction in bicycle fatalities and injuries from traffic accidents? No, it instead measure the miles of bike lanes, the reallocations of street space to dedicated bicycle use, reductions in automobile speed limits, and changes to intersections favoring bicyclists. The fact that these “improvements” have been accompanied by increased bicycle fatalities and reductions in bicycle commuting aren’t considered. Continue reading

Mid-Day Traffic Now Worse Than AM Rush Hour

Morning and afternoon rush-hour traffic has returned to pre-pandemic levels in many U.S. urban areas, according to INRIX’s 2023 Global Traffic Scorecard. However, what INRIX finds most “astonishing” is that mid-day traffic has grown by an average of 23 percent and is now much greater than during the morning rush hour, and almost as great at around noon as the afternoon rush hour.

U.S. Trips by Start Hour in 2019 and 2023

This will only be astonishing to people who haven’t read the several research studies finding that people who work at home drive more miles per day than people commute who work. As the above chart indicates, morning rush-hour traffic in U.S. urban areas is down 12 percent while afternoon rush-hour traffic is down 9 percent; but total traffic is up because of the 23 percent increase in mid-day traffic. Continue reading

April 2024 Transit Ridership 74.6% of 2019

Transit systems carried less than 75 percent as many riders in April 2024 as in the same month before the pandemic, according to data released by the Federal Transit Administration last week. Transit ridership tends to be significantly greater on weekdays than weekends and holidays, but April had the same number of business days in both years. Ridership has been hovering between 73 to 76 percent for the last eight months and since March 2020 has never actually reached 76 percent of pre-pandemic levels.

Of the major modes, bus-rapid transit is doing best with 111 percent of 2019 riders, but that’s mainly because cities such as Houston, San Francisco, and Tampa opened BRT routes between 2019 and 2024. Conventional buses carried 80 percent of 2019 riders, light rail 74 percent, and heavy rail under 70 percent. Commuter trains carried 67 percent but commuter buses carried only 49 percent. Continue reading

April 2024 Driving 6.3% Less Than April 2019

Americans drove 6.3 percent fewer miles in April of 2024 than the same month of 2019, according to data released yesterday by the Federal Highway Administration. This is the first time in nine months that miles of driving have fallen below 99 percent of the same months in 2019.

April driving was also 4.2 percent less than in March 2024. In “normal” years, such as 2018 and 2019, Americans have driven more miles in April than March despite the former having one fewer day, probably because of better weather in April. Continue reading

April Amtrak 101%, Air Travel 105% of 2019

Amtrak carried 100.9 percent as many passenger-miles in April of 2024 as in the same month of 2019, according to the state-owned company’s most recent monthly performance report. Meanwhile, the Transportation Security Administration reports that airlines carried 105.3 percent as many passengers as in 2019.

April data for transit and highways will be posted here as soon as it becomes available.

A close look at Amtrak data reveals that the Northeast Corridor is carrying the system. While April NEC ridership was 10.2 percent greater than in 2019, ridership on state-supported day trains was more than 8 percent short of 2019 and ridership on long-distance trains was almost 8 percent below 2019. That’s been roughly the pattern for the year to date as well. Continue reading

Who’s to Blame for Increase in Cycling Fatalities?

The National Highway Traffic Safety Administration (NHTSA) recently reported that more than 1,100 bicycle riders died in U.S. traffic accidents in 2022. That’s a 77 percent increase from 2010 and the most bicycle fatalities in recorded history (which goes back to 1932).

Do bike lanes make streets safer for bicycle riders? Photo by Missouri Bicycle Federation.

Bicycle advocates blame the increase on larger automobiles, particularly pickups. But the numbers don’t necessarily bear that out. In order to reduce fatalities, they want “safer street designs,” but the numbers don’t support that either. Continue reading

SEPTA’s Bus Revolution Not Revolutionary Enough

The Southeastern Pennsylvania Transportation Authority (SEPTA) is planning to revolutionize its bus network next year. While transit systems are due for a revolution, the agency’s plan isn’t revolutionary enough.

Click image to go to a map comparing SEPTA’s current dense bus routes (left) with the proposed sparser bus network (right).

The problem with most bus systems is that they focus on downtowns to the exclusion of the rest of the region. Before the pandemic, half of all workers in downtown Philadelphia took transit to work, but only 8 percent of the region’s workers worked downtown. The bus system did such a poor job of serving the rest of the region that less than 6 percent of workers who didn’t work downtown commuted by transit. Continue reading

Transit $60 Million in the Hole? Build a Monorail!

In case anyone believes that transit advocates haven’t completely lost their grip on reality, take a look at Memphis. The new CEO of the Memphis Area Transit Authority (MATA) has “discovered” a $60 million deficit in the agency’s budget that “prior leadership was unaware of.”

Memphis’s transit agency can’t afford to keep its streetcars running and has a $60 million deficit, so naturally people want to build a monorail or light-rail system. Photo by Charles Phillips.

How can you not be aware of a $60 million deficit? According to the new CEO, before she took the job, “MATA’s executive leaders did not have access to the company’s detailed financials.” Why not? How could anyone claim to be a leader and not demand access to financial information for the entity they were supposedly leading? Continue reading

March Driving 101.4% of 2019

Americans drove almost 1.5 percent more miles in March of 2024 than in the March before the pandemic, according to data released yesterday by the Federal Highway Administration. Miles of driving have been at least 100 percent of 2019 numbers in six of the last eight months and at least 99 percent in 28 of the last 36 months.

Rural driving was 9.1 percent greater than in 2019 while urban driving was 1.8 percent less. The states with the biggest growth in driving are Indiana (33.8%), Montana (25.2%), Louisiana (23.0%), Arizona (17.0%), Idaho (16.6%), and Rhode Island (13.7%). The District of Columbia also saw 16.2 percent more driving in March 2024 than in 2019. Continue reading

Transit Carried 75.6% of 2019 Ridership in March

My trip through the Owyhee River Canyon went very well, thank you, except for a flat tire on my return home. The transit industry seems to be suffering from a perpetual flat tire, as it carried only 75.6 percent as many riders in March of 2024 as it did in the same month in 2019, according to data posted last week by the Federal Transit Administration. That’s down slightly from 76.0 percent of daily riders in February (adjusting for leap day and correcting for data missing in February’s report). March had the same number of business days in 2024 as in 2019 so no adjustment is necessary there.

The Federal Highway Administration has not yet posted March highway data, but I’ll post an update here as soon as it does.

A handful of major urban areas — Kansas City, Richmond, Oklahoma City, and Tucson — have seen ridership recover to 100 percent of pre-pandemic levels, but this is often because they have eliminated transit fares. From an economic viewpoint, you can’t say there is a significant demand for your service if you have to give it away for large numbers of people to use it. Continue reading