
Morning and afternoon rush-hour traffic has returned to pre-pandemic levels in many U.S. urban areas, according to INRIX’s 2023 Global Traffic Scorecard. However, what INRIX finds most “astonishing” is that mid-day traffic has grown by an average of 23 percent and is now much greater than during the morning rush hour, and almost as great at around noon as the afternoon rush hour.
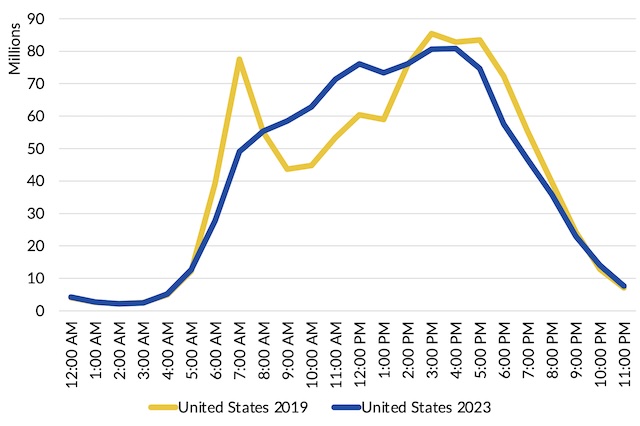
This will only be astonishing to people who haven’t read the several research studies finding that people who work at home drive more miles per day than people commute who work. As the above chart indicates, morning rush-hour traffic in U.S. urban areas is down 12 percent while afternoon rush-hour traffic is down 9 percent; but total traffic is up because of the 23 percent increase in mid-day traffic.
Although one of the research studies finding that telecommuters drive more frets that the increased driving will increase greenhouse gas emissions, that isn’t necessarily true. Fuel consumption and greenhouse gas emissions are a function not just of miles of driving but the traffic conditions: less stop-and-go driving means less fuel consumption and emissions. An INRIX study of Atlanta found, for example, that an 8 percent decline in overall in driving resulted in a 15 percent decline in greenhouse gas emissions. This suggests that, contrary to popular belief, building more roads to relieve congestion can be an important way to reduce greenhouse gas emissions.
The INRIX traffic study found that New York had the worst congestion of any urban area in the world in 2023, with the average driver losing 101 hours to delays. This was 11 percent more than in 2019. Hours of delay per driver had also increased by 18 percent in Chicago and Miami, 17 percent in San Antonio, and 12 percent in Dallas.
Remember, however, that not all of those delay hours were during rush hours. It is quite likely that rush-hour traffic remained below pre-pandemic levels in almost all U.S. urban areas, but that decline is partly made up for by delays during mid-day periods.
Even counting mid-day traffic, most U.S. urban areas had significantly less congestion in 2023 than in 2019. Among major urban areas, Baltimore congestion was down 24 percent, Hartford was down 18 percent, Cincinnati down 17 percent Austin down 14 percent, Seattle and Denver both down 11 percent, Washington down 9 percent, Portland down 8 percent, and Los Angeles was down 4 percent.
Out of 290 U.S. urban areas ranked by INRIX, 2023 congestion was worse than in 2019 in 88, was unchanged in 8, and was not as bad in 194. The U.S. experience, where congestion was lower in two-thirds of urban areas, was the opposite of Europe, where two-thirds of urban areas suffered more traffic delays in 2023 than in 2019. That’s probably because European cities have greater concentrations of jobs located in downtowns, where traffic is likely to be worst.
While the average U.S. driver wasted 42 hours in traffic in 2023, that’s way down from 2019 when the average driver lost 99 hours. INRIX estimates the total 2023 cost of congestion to auto drivers was more than $77 billion. INRIX did not estimate the cost to trucking companies, but the American Transportation Research Institute estimated it was almost $95 billion in 2021, and was probably greater in 2023.
New York City’s controversial “congestion pricing” plan, which was really a cordon pricing plan, would not have fixed the problem. The city’s plan called for charging a flat fee to drive into lower Manhattan between 5 am and 9 pm. Planners predicted that this would reduce the number of vehicles entering this zone by 100,000 per day.
There are two reasons why this plan would fail to relieve congestion in the long run. First, while a flat fee would cause a one-time reduction in traffic, it would do nothing about traffic growth over time. London’s cordon pricing significantly reduced traffic at first, but within a few years traffic was back. INRIX rated London as the most congested urban area in the world in 2022 and third-most in 2023.
An even more important problem is that charging the same fee for 16 hours of the day does nothing to relieve congestion during the most congested parts of the day. If rush-hour congestion happens because people get a greater value from driving during those hours, and the fee is the same whether they drive at 5 am or 5 pm, then the fee is going to have less of an effect during rush hours than other hours of the day. Ultimately, cordon pricing is a fund-raising tool, not a congestion relief tool.
True congestion pricing, which means charging more to drive on a particular road when the traffic on that road is the greatest, would help solve these problems. Such pricing is applied to certain tolled highways in California, Texas, the Washington DC area, Denver, and a few other places. While it practically guarantees that those highways rarely if ever experience significant delays, the policy remains unpopular among people who fear that it prices people off the roads and that electronic toll collection could invade people’s privacy.
One alternative to true congestion pricing is to build more roads. This is a lot more expensive than congestion pricing and is politically unpopular with people who fear that more roads will lead to more driving. However, as Matthew Yglesias points out, there’s nothing wrong with allowing people to take “advantage of new opportunities and making their life better.”
“The only thing worse than a new highway project that only causes people to drive more would be a new highway project that didn’t cause people to drive more and wasted a bunch of money,” Yglesias points out. I would add that this is especially true if the new roads are paid for using highway user fees rather than being subsidized by general taxes.
One thing that won’t help congestion is spending more money on public transit. As Department of Transportation data show, transit seems to be stuck at about 75 percent of pre-pandemic ridership, and wildly spending on new light-rail lines or converting general purpose lanes into dedicated bus-rapid transit lanes is not going to significantly increase ridership. Since transit carries less than 1 percent of passenger travel, even a large increase in ridership would have a trivial effect on overall driving.
The other alternative is simply to let congestion grow. People will respond to that by moving their homes and work places to less congested areas. Urban areas such as San Francisco, San Jose, and Seattle that attempt to stop sprawl will lose population to urban areas such as Atlanta, Dallas, and Houston that allow people to build in uncongested areas. Such movement is already taking place and is blamed on high housing prices and regulation in California, but congestion is also a part of it.
In any case, the key takeaway is that the pandemic did reduce congestion in most U.S. urban areas but it didn’t reduce overall driving. Those who fantasize a world with no cars are going to be disappointed and those who make policies based on such fantasies do Americans a serious disservice.


One thing for sure is that arterial routes/collectors/stroads are horrible in terms of addressing congestion.
Especially these 6 lanes, 45 mph, long traffic light intersections. Look what was done in Carmel, Indiana.
Cyrus992,
Arterials don’t address congestion? This isn’t true whatsoever.
I suppose @Antiplanner turning off the comments. Your comment section is useless.
support*
Well handle congestion properly.
NYC congestion charge is not a congestion charge, it’s a Cordon fee. And second has NOTHING to do with congestion, it’s about fixing the decrepit subway. If the benefits of Urban population density are so advantageous, the MTA wouldn’t need auto drivers to pitch in to contribute to the financial stability America’s Busiest rail system.
It’s not about cluttered roads it’s about a transit agency’ Billion $$$ maintenance backlog. They shouldn’t have picked a technology so prone to deterioration/financial mismanagement. It will NEVER be fixed. It has 38 BILLION dollar maintenance backlog (that even a billion a year will take decades to repair) and 20 billion in health/pension obligations to it’s MTA employees that are unmet. MTA abuses 1.4 Billion in overtime pay
https://ti.org/antiplanner/?p=19445
MTA could terminate all overtime and divert funds to critical repair, because bureaucracy abuses it too.
Even if it did; undoubtedly would result in strikes or walk off or worse riot; The “French” method.
Real solution here is to hand maintenance contract over private contractor with no ties to New York, let them fabricate track/electric wire replacement and upfinishing stations. 2nd is to curb costly service by shutting down it’s least used stations or lines. And we saw it before 30 years ago in Japan. JNR went belly up; their first instinct “Privitization” was fought against; labor refused to budge. Bullet was bit inevitably, JNR began downscale, laid off HALF it’s workforce.
Always remember that ”Congestion” is Orwellian Doublespeak for “traffic”
Yet Urbanists installed islands, lane narrowing, turned miles of once driveable streets into little parks and lower speed limits lower vehicle per hour through puts….
After all they wanna lower vehicle speeds in cities for safety…. Now wanna charge us to drive on roads they deliberately re-engineered to reduce thru puts?
Caused by “you drivers”
Even more so, the paradox/hypocrisy resting financial means for MTA’s welfare on auto drivers is what happens if you succeed in reducing cars in the city? Since a decline in driving is detrimental. At 15 bucks a pop, 1 billion in revenue works 15 dollar charge for 182,000 daily drivers. It’s inconsequential, since most fees will be diverted. How do we know, because not the first time….
2010’s Port Authority/NYC raised bridge/tunnel fares thru New York and New Jersey, to pay cost overruns for this, the Vagina/Stegosaurus shaped PATH station.
https://en.wikipedia.org/wiki/World_Trade_Center_station_(PATH)
Outside geometrically simple Manhattan, Rail transit is vastly economically inferior to buses or small vans.
BART in San Francisco has only 50 stations on 6 routes. Average Human walking speed is about 2-3 miles per hour….meaning if you draw a 0.75 mile (the distance you can walk in 15 minutes) radii; a 1.5 mile circle on Google maps around every station only less 10 percent of San Francisco/Bay Area is walkable without a car. Making city Accessible via rail transit means 50-100 Billion in new rail lines including 4-5 East-west routes to link with existing lines.
“Mid-Day Traffic Now Worse Than AM Rush Hour”
Just a little more highway widening and we’ll fix it!
All the efforts you describe are attempts by the anti-car people to make driving so miserable that people will be “forced” to take transit. As the article notes, people tend to move their jobs and homes when planners try to “force” them into transit. That’s why transit advocates will never succeed.