February Driving Up 2.3 Percent from 2019

After accounting for Leap Day, Americans drove almost 2.3 percent more miles per day in February 2024 than in the same month of 2019, according to data released by the Federal Highway Administration on Friday. Rural driving was 9.7 percent more than before the pandemic while urban driving was 0.8 percent less. At least some of these differences are due to people moving from urban to rural areas.

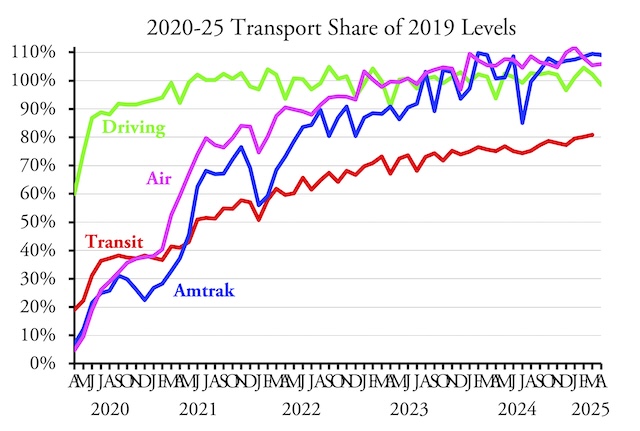
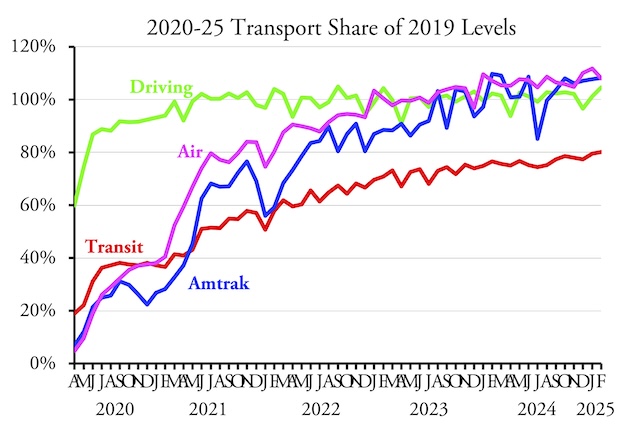
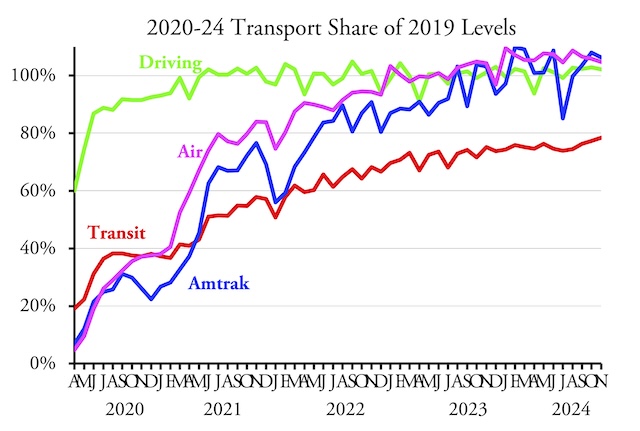
The February 2024 line for driving is obscured by the line for Amtrak, but both are approximately 102 percent.

While Amtrak, air travel, and driving have all fully recovered from the pandemic, transit has not. When I posted February 2024 transit data last week, someone commented that “Some areas have nearly recovered” while “areas like the Bay Area drag the data down.” It’s true that a handful of areas have recovered, in many cases because they are giving away transit rides for free. But most have not, unless you define 80 percent as “nearly recovered.” As of last week’s February data, out of the nation’s 50 largest urban areas, only 2 have fully recovered and only three more saw 90 percent of pre-pandemic ridership. Continue reading

2022 Highway Subsidies Were 1¢/Passenger-Mile

U.S. highways, roads, and streets received a little over $65 billion worth of subsidies in 2022, according to data recently released by the Federal Highway Administration. Apportioning these subsidies to passengers and freight, they work out to about 1.0¢ per passenger-mile and 0.7¢ per ton-mile. For comparison, subsidies to transit averaged $2.39 per passenger-mile while subsidies to Amtrak averaged about 40¢ per passenger-mile.

The Key Bridge in Baltimore collapsed yesterday due to being struck by a ship. If this had happened before 2021, it is likely that some lobby groups would have blamed the collapse on poor maintenance. Such claims led Congress to give the Federal Highway Administration an additional $90 billion, to be spent over six years, in the 2021 infrastructure law.

I calculated the highway subsidy numbers from the Federal Highway Administration’s latest edition of Highway Statistics. The agency once published this report as a book but now issues it as a series of spreadsheets. Earlier this month, I reported on spreadsheets showing the volume of traffic carried on the highways, but the financial spreadsheets were not yet available. Now they are. Continue reading

A New View of Congestion

The GPS company TomTom recently published its rankings of urban areas by the amount of congestion people face. Like many other congestion studies, the rankings estimate the amount of time the average motorist wastes during rush hour. But that may not be the best measure of mobility.

Is Vancouver the most congested urban area in the U.S. or Canada?

TomTom also listed the average speed of traffic in each city center and metro area, both during rush hours and over the course of a day (calculated using the number of minutes required to go six miles). The time wasted was calculated by measuring how much slower traffic was during rush hour compared with the rest of the day. Urban areas could reduce the hours of delay by increasing traffic speeds during rush hour. But they could also reduce the calculated hours of delay by reducing traffic speeds during non-rush-hour periods. Continue reading

January Miles of Driving 99.5% of 2019

In January 2024, Americans drove 99.5 percent as many miles as they did in the same month of 2019, according to data released yesterday by the Federal Highway Administration. This compares with 103.1 percent in December.

See this post for a discussion of Amtrak and air travel and this post for a review of transit data for January 2024.

January had the same number of business days in 2024 as in 2019, so that doesn’t account for the drop below 100 percent. Instead, this drop is more likely due to the mid-January snowstorm that blanketed much of the United States. Continue reading

Transit Use Shrinks to Insignificance

Transit in 2022 carried less than 1 percent of passenger travel in 461 out of the nation’s 487 urban areas and less than half a percent of passenger travel in 426 of those urban areas. It carried more than 2 percent in only 7 urban areas and more than 3 percent in just two: New York and San Francisco-Oakland. These numbers are calculated from the 2022 National Transit Database released last October and the 2022 Highway Statistics released last month, specifically table HM-72, which has driving data by urban area.

Highways were a little less congested in 2022 than before the pandemic. Oregon Department of Transportation photo.

In 2019, transit carried 11.6 percent of motorized passenger travel in the New York urban area, a share that fell to 8.5 percent in 2022. Transit carried 6.8 percent in the San Francisco-Oakland area in 2019, which fell to 3.6 percent in 2022. Transit carried around 3.5 percent in Chicago, Honolulu, Seattle, and Washington urban areas, which fell to 2.5 percent in Honolulu, 2.1 percent in Seattle, and less than 1.8 percent in Chicago and Washington in 2022. Anchorage, Ithaca, and State College PA are the only other urban areas where transit carried more than 2 percent of travel in 2022. Continue reading

The Benefits of Congestion Relief

Data published by the University of Minnesota Accessibility Observatory a few months ago reveals some of the benefits of congestion relief that resulted from the COVID pandemic. I’ve used 2019 data in the past to show that residents of U.S. urban areas can reach far more jobs in a 20-minute auto drive than a 60-minute transit trip. The latest data for 2021 reveal that the number of jobs reachable by transit or bicycle was about 9 percent greater in 2021 than 2019, but the number reachable by a 20-minute auto drive was 66 percent greater.

On average, over 50 urban areas and for trips of 10 to 60 minutes, auto users were able to reach 48 percent more jobs in 2021 than in 2019. Solid lines show 2021 and dotted lines show 2019.

These numbers are the average of the nation’s 50 largest urban areas, but for some the increased access caused by less traffic was much greater. In a 20-minute auto drive, residents of Atlanta, Boston, Los Angeles, San Francisco, San Jose, and Washington could reach more than twice as many jobs in 2021 than in 2019. Of course, jobs are only one possible set of destinations that became more accessible; other social and economic opportunities also became equally more accessible. Continue reading

Who Benefits from Variable-Priced Road Tolls?

The Oregon Department of Transportation is planning to toll all lanes of major freeway in the Portland area soon. The San Francisco Bay Area Metropolitan Transportation Commission is considering tolling all freeways in the region later this decade. Plans such as these always raise charges that they will heavily impact low-income drivers.

An electronic tollgate that collects tolls without slowing traffic. Photo by OnionBulb.

In response, the Antiplanner has argued that low-income people will greatly benefit from variable-priced tolling. While many taxes, including gas taxes, are regressive, tolling is not because people pay for only what they use. Congestion, however, is regressive because low-income people are less likely to be able to work at home or on flexible schedules that allow them to avoid rush hour. “If variable user fees can relieve that congestion, working-class people will be among the greatest beneficiaries.” Continue reading

September VMT Continues to Exceed 2019

Americans drove 1.4 percent more miles in September 2023 than in the same month in 2019, according to data released by the Federal Highway Administration yesterday. Vehicle miles of travel (VMT) have exceeded 2019 numbers in seven out of the last twelve months.

Most of the increase in driving was in rural areas. Although September’s rural driving was 4.6 percent greater in 2023 than 2019, urban driving was only 0.1 percent greater. The increase in urban driving was on collector and local streets; freeway and arterial driving were still a little short of 100 percent of 2019 miles. Continue reading

Keep Highway User Fees

The Tax Foundation notes that Republican presidential candidate Nikki Haley has proposed to save consumers money by eliminating federal fuel taxes. That’s an extremely short-sighted idea that would actually cost consumers in the long run. As the foundation’s writers, Alex Muresianu and William McBride, observe, Haley could have proposed that the gas tax, an imperfect user fee, be replaced with a better user fee such as a mileage-based fee. But instead she proposed to simply eliminate the tax.

A sunset for gas taxes?

The most recent report indicates that, as of yesterday, the price of regular gasoline averaged about $3.64 nationwide. Eliminating the federal gas tax would reduce that to by 18¢ to $3.46 a gallon — less than 5 percent. Encouraging more domestic oil production could cut fuel prices by more than a dollar a gallon, down to what prices were in around 2015-2020. If Haley wants driving to be more affordable (which I think would be a good thing), that’s what she should promote. Continue reading

Do Higher Speeds = Higher Incomes?

A new study published by the National Bureau of Economic Research (ungated copy) finds that, whaddyknow, faster urban speeds are associated with richer countries. The study looked at urban travel speeds in 1,200 cities around the world to “find that improved urban mobility is an important and previously undocumented feature of economic development.”

Important yes, but hardly previously undocumented, as researchers such as Rémy Prud’Homme in France and Sam Staley and Adrian Moore in the United States have looked at the relationship between travel speeds and economic productivity. That has also been a consistent theme of the Antiplanner, especially when comparing the ability of fast cars vs. slow transit to help people out of poverty. Continue reading