The Washington Post has discovered that there are “inefficiencies” in the nation’s affordable housing programs, including its largest one, low-income housing tax credits. Due to these inefficiencies, one non-profit developer in DC is spending up to $1.3 million per housing unit. Another developer spent $800,000 per unit, while right next door the very same developer built market-rate housing for just $350,000 per unit.

Ontario Place, a so-called affordable housing project that is costing $1.2 million per unit.
Ontario Place, the project pictured above, “will include a rooftop aquaponics farm to produce fresh fruits and vegetables for its tenants,” which contributed to the $1.2 million per unit cost. Another expensive project found by Post writers, which cost “only” $815,000 per unit, “includes a fitness room to encourage physical activity, a library, a large café with an outdoor terrace, a large multi-purpose community room with a separate outdoor terrace, an indoor bike room, on-site laundry, lounges and balconies on every floor.” Continue reading

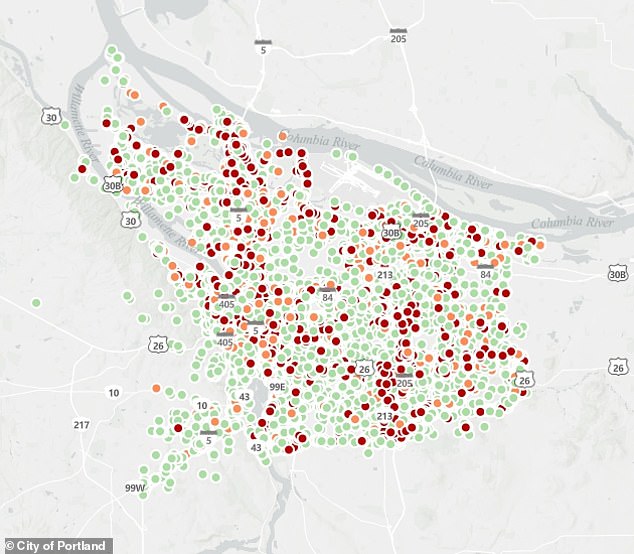 This map shows homeless camps identified by the city of Portland. Colors indicate the risk of crime each camp supposedly poses to nearby neighborhoods.