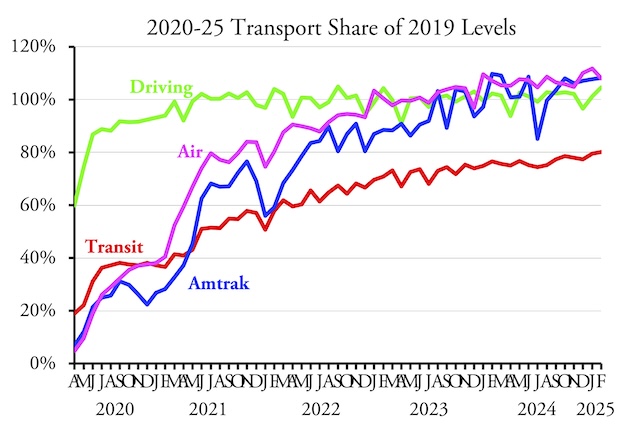
September Transit Ridership 76.3% of 2019

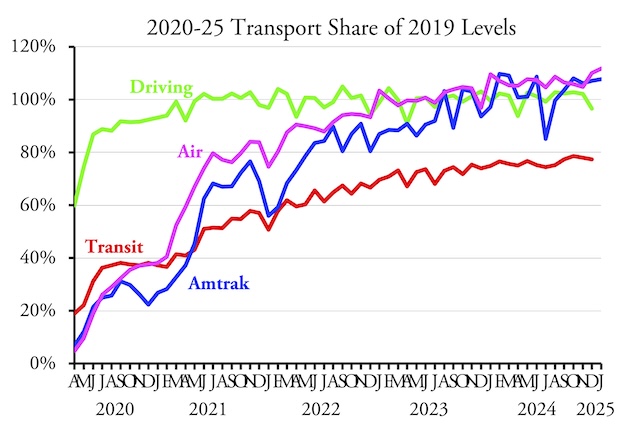
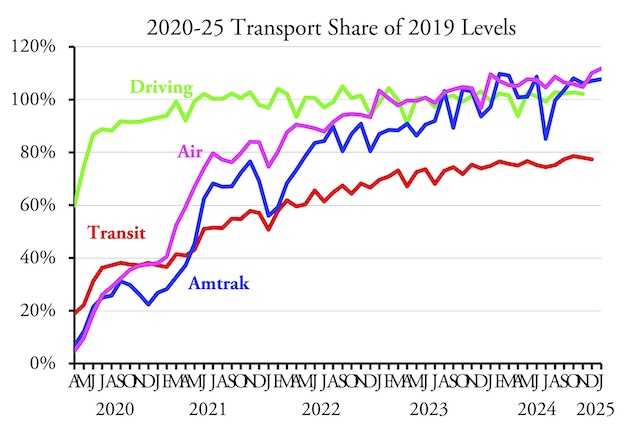
Transit agencies carried 76.3 percent as many riders in September of 2024 as they did in the same month in 2019, according to data released yesterday by the Federal Transit Administration. This is transit’s best performance, when measured as a share of pre-pandemic numbers, since the pandemic began.

Highway and Amtrak results for September will be posted here when it becomes available.

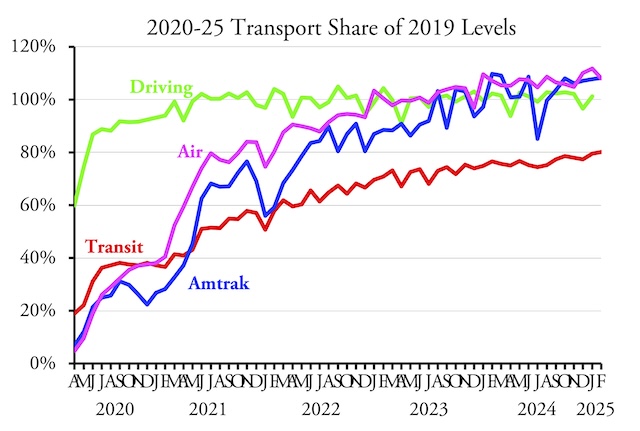
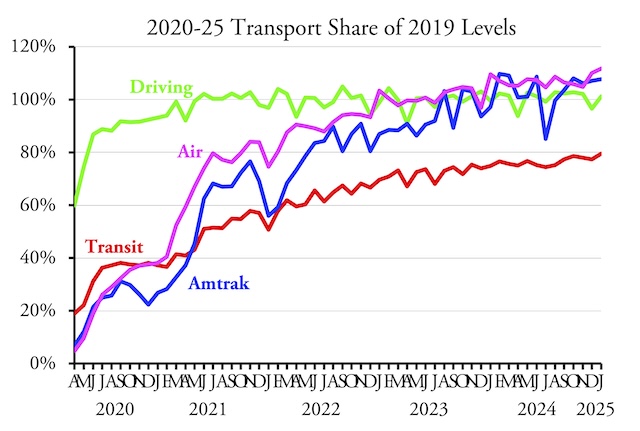
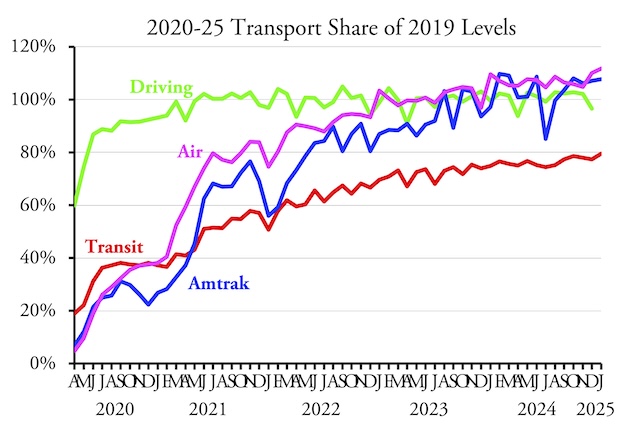
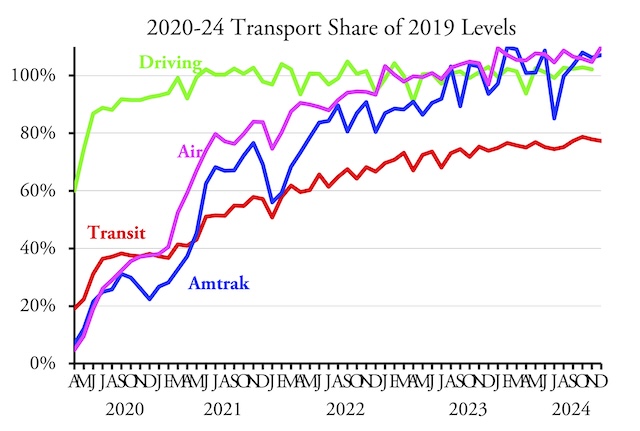
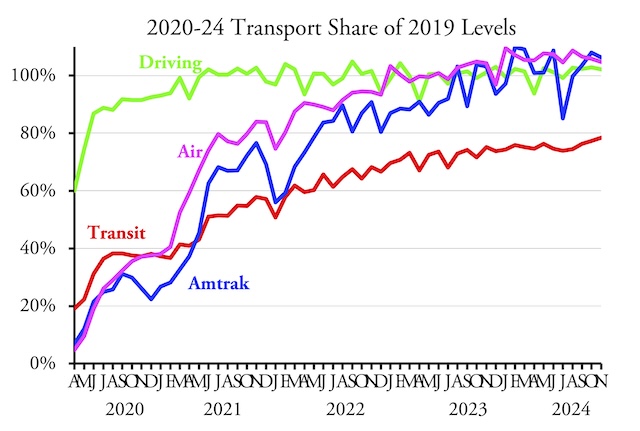
Highway travel had fully recovered from the pandemic by around July 2021. Air travel, which the Transportation Security Administration says carried 108.7 percent as many travelers as in September 2019, had recovered by January 2023 and Amtrak by October 2023. In October 2023, transit ridership still hadn’t reached 75 percent of pre-pandemic numbers, but that is probably the best it was going to do. Some of the growth in transit since then is due to some people returning to downtown offices, but much of that growth is probably more attributable to regular growth, not to recovery from the pandemic. Continue reading

August Driving Nearly 103% of Pre-Pandemic Miles

Americans drove 102.7 percent as many miles in August of 2024 as in the same month of 2019, according to data released yesterday by the Federal Highway Administration. Moreover, this is the first month I can remember since the pandemic began that driving exceeded pre-pandemic numbers on all types of roads, including urban and rural interstates, other arterials, and other roads.

For a discussion of Amtrak and airline data, see this post. For a discussion of transit data, see this post.

August 2024 driving was greater than 2019 driving in 28 states, while it was less in 22 states plus DC. DC driving was slightly less than 80 percent of 2019 miles, and miles of driving were also particularly low in Delaware (82%), Hawaii (84%), West Virginia (86%), and Massachusetts (88%). Continue reading

Lower Fares, Higher Operating Costs

Transit agencies carried 18 percent more riders in 2023 than 2022, but 29 percent fewer than in 2019. Average trip lengths declined from 5.5 miles in 2019 to 5.0 miles in 2023, probably because commuter rail and commuter buses, which tend to carry riders the longest distances, did particularly poorly. Overall transit carried 35 percent fewer passenger-miles in 2023 than in 2019. These data are based on the National Transit Database and in particular the 2023 database that the Federal Transit Administration released last week.

A bus-rapid transit line has generated lots of positive publicity for Cleveland transit, but the truth is that Cleveland has one of the worst-performing transit systems in the country, with ridership falling 35 percent between 2014 and 2019 and another 30 percent between 2019 and 2023. Photo by GoddardRocket.

Fares were proportional to passenger-miles being 35 percent less than in 2019, while operating costs were 22 percent greater. The result was that the operating subsidy per rider, at $7.26, was more than twice 2019’s, which was $3.51 and only a slight improvement over 2022’s operating subsidy of $7.59 per rider. Operating subsidies per passenger-mile grew from 64¢ in 2019 to $1.51 in 2022, declining only slightly to $1.45 in 2023. Continue reading

Housing Data for 2023

The median owner-occupied home was worth $340,000 in 2023, which was 3.5 times median family incomes, according to 2023 American Community Survey data recently released by the Census Bureau. While a value-to-income ratio of 3.5 is still quite affordable, it isn’t as affordable as the 3.0 ratio in 2019. The difference is probably mainly due to supply-chain problems and labor shortages since the pandemic.

More than 6 million single-family homes were added to the nation’s housing stock between 2019 and 2023.

Despite the increase in housing costs relative to incomes, homeownership grew from 64.1 percent in 2019 to 65.2 percent in 2023. Moreover, despite densification programs in many major cities, the population of people living in single-family homes grew from 73.6 percent in 2019 to 74.3 percent in 2023. Continue reading

Transit’s Ride into Irrelevance

Just 3.5 percent of American workers commuted to work by public transit in 2023, according to American Community Survey data recently released by the Census Bureau. That’s down from 5.0 percent in 2019. Since transit ridership so far in 2024 is only about 4 percent more (when measured as a share of 2019 numbers) than it was in 2023, the 3.5 percent number is not likely to improve much in the future.

The increase in remote working has permanently shifted transportation patterns and particularly devastated transit ridership.

According to the survey data, the share of people working at home in 2023 was 13.8 percent, down from 15.2 percent in 2022 but up from just 5.7 percent in 2019. As I’ve noted before, the increase in remote working has a double impact on transit ridership. First, the downtown workers who were transit’s main customers before the pandemic are more likely to work at home than many other people. Second, the reduction in congestion resulting from increased remote working will lead some people who were avoiding congestion by riding transit to return to driving. Continue reading

August Transit Ridership 74.5% of 2019

America’s transit systems carried 25.5 percent fewer riders in August of 2024 as in the same month of 2019, according to data released by the Federal Transit Administration last Friday. Transit ridership has hovered around 75 percent of pre-pandemic levels since November 2023.

I previously reported that July transit ridership was only 71.1 percent of 2019, but warned that several major transit agencies had not yet submitted July numbers. Those agencies, I estimated, made up about 2.5 percent of U.S. transit ridership so I guessed that the real number would be 73.6 percent. I was off by a bit: all major agencies have report July numbers and July ridership was 73.9 percent of 2019. Continue reading

Amtrak Recovers to 99.7% of Pre-Pandemic PMs

Amtrak carried 99.7 percent as many passenger-miles in August 2024 as in the same month of 2019, according to the state-owned company’s monthly performance report. This was up from 85.1 percent in July. While Amtrak was still slightly short of pre-pandemic levels, domestic airline flights comfortably carried 8.7 percent more passengers in August 2024 than in 2019, according to TSA passenger counts.

The Department of Transportation has not yet posted August highway or transit data but when it does the results will be reported here.

While Amtrak numbers are in passenger-miles (which is the preferred measure) and airline numbers are in passenger counts, data from the Bureau of Transportation Statistics show that these follow one another fairly closely. In June, the most recent month for which such data are available, domestic flights carried 6.8 percent more passenger-miles than in June 2019. Continue reading

July Driving 99.2% of 2019

Americans drove 99.2 percent as many miles in July 2024 as the same month in 2019, according to data published by the Federal Highway Administration yesterday. This is one of the few times that monthly highway traffic data have been released before transit ridership data.

July transit data are not yet available.

Except in April 2024, when driving dipped below 94 percent of pre-pandemic levels, miles of driving have been 99 percent to 103 percent every month for the last year. As usual, rural driving was more: 3.5 percent above 2019, while urban driving was 2.8 percent less than in 2019. However, driving on urban interstates grew 1.4 percent.

Transit Carried 74.9% of 2019 Riders in June

After creeping up above 75 percent of pre-pandemic ridership for the first time in May, transit ridership fell back down to 74.9 percent in June, according to data released by the Federal Transit Administration on Tuesday. Meanwhile, air travel continued soaring at 7.4 percent above pre-pandemic numbers, according to TSA counts.

Data are not yet available for Amtrak and driving but will be posted here as soon as they are.

Transit’s failure to recover from the pandemic is due largely to its downtown-centric orientation in most urban areas. Before the pandemic, almost half of all transit commuters in the nation’s 50 largest urban areas worked downtown, and almost half of downtown workers commuted by transit whereas less than 6 percent of non-downtown workers used transit to get to work. Although less than 10 percent of urban employees worked downtown, transit didn’t work for most of the other 90 percent. Continue reading