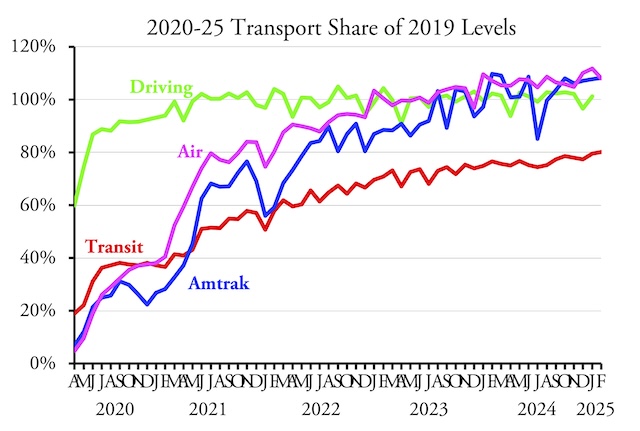
America’s public transit systems carried 80.1 percent as many riders in February 2025 as in the same month of 2019, according to data released by the Federal Transit Administration on Friday. This is the first month since the pandemic that ridership exceeded 80 percent of pre-pandemic riders.
Highway data are not yet available but will be reported here soon.
It might seem a bit picky to point it out, but the pandemic didn’t begin to have an effect on transportation until March, 2020, so February numbers should really be compared with February 2020. In that case, transit carried only 77.4 percent of pre-pandemic numbers in February 2025 (after adjusting for the fact that February had 29 days in 2020). The lines in the chart, however, are based on 2019.
New York urban area transit systems, which carry close to half of all transit riders in the country, have recovered more than most, having carried 87.8 percent of 2019 numbers (and 80.5 percent of 2020 riders). Some call this a “benefit” of New York’s cordon pricing system, but is it really beneficial to force people out of transportation systems that largely pay for themselves and onto transportation systems that demand huge and continuing subsidies? Certainly the marginal cost of adding a few riders to transit systems that are running below capacity is low, but adding those riders also gives the agencies another excuse to demand increased subsidies.
New York’s increase has pushed New York’s share of total transit riders from as low as 40.1 percent in 2008 to 47 percent in 2025 to date. Outside of the New York urban area, transit carried only 74.5 percent as many riders in February as in the same month of 2019 and 74.8 percent of February 2020.
In addition to New York, ridership numbers in Los Angeles (83.7%), Miami (84.0%), Dallas (82.6%), Houston (83.7%), and Washington (85.2%) are all above average (when compared with 2019). Washington’s increase is almost certainly due to the federal back-to-work mandates.
Ridership recovery remains well below average in Chicago (63.6%), Philadelphia (72.1%), Atlanta (54.2%), Boston (70.5%), Detroit (72.5%), Phoenix (58.3%), and San Francisco-Oakland (66.2%). Transit is probably recovering the most in urban areas whose downtowns have come closer to full recovery, but unfortunately we don’t have city-by-city downtown recovery data more recent than October 2023.
A major problem with U.S. transit agencies is that they are almost completely insensitive to ridership. Despite carrying an average of 22.6 percent fewer riders than in February 2020, U.S. transit systems were still running 97.1 percent as much transit service in 2025. They’ve been paying for this out of federal COVID relief funds, and now that funds are running low they’ve been plaintively seeking increased subsidies from state and local governments.
Kansas City, which had been providing fare-free transit, decided last week to re-institute fares and, despite that, will have to reduce service. This seems like a logical response to declining ridership, but California is seeking ways to raise taxes so that BART and other Bay Area transit agencies can continue to operate despite low ridership.
Legislators who throw money at transit only make agencies even less sensitive to ridership, which means they won’t bother to institute the major structural changes needed to make their services relevant to more people. Instead of adapting their operations to modern urban life, they want to force people to redesign their lives so they will be more likely to ride obsolete transit systems. This is not only authoritarian, it is a recipe for failure because today’s slow and inconvenient transit systems will never be competitive with automobiles. That, in a nutshell, is why transit is still carrying only 80 percent of pre-COVID numbers when all other forms of transportation have fully recovered.
As usual, I have posted an enhanced version (21.7-MB) of the Federal Transit Administration’s monthly update to its database. In addition to the FTA’s raw data, this spreadsheet has totals by year (from 2002 to the present), mode, transit agency, and urban area. These enhancements are made on both the ridership (UPT for unlinked passenger trips) and service (VRM for vehicle revenue-miles) worksheets.


Might seem picky to point it out but in addition to thousands of miles of high speed rail, China has flying cars now
https://x.com/Azikadylia/status/1908584729521373457
A multi rotor drone scaled up to human car size is destined to fail. As we’ve seen this tech for a over a decade already.
Jane still beats it to his Mao propaganda. Multi rotor aircraft birder the isle instability everywhere they go. That’s why Chinese never stole the V22.
Wana talk about China rail, how about accident last year killed thousands of people.
Not a thousand. THOUSANDS….
Heavy rain amd poor foundation work led subway tunnel collapse under the road above it.
China has had 95 subway collapses since 2001.
Or the Chinese built skyscraper fell in Thailand earthquake.
That “flying car” is more helicopter (we have lots of those) than car.
Vietnam’s touted “high speed” choochoo (obsolete technology btw) misses key deadline – will start construction a year earlier than planned:
https://e.vnexpress.net/news/news/vietnam-eyes-to-begin-high-speed-rail-construction-in-2026-4870727.html