Highway Safety Is Improving

A CBS Sunday Morning report promoted driverless cars as a way of improving highway safety. I’ve been saying the same thing for years, but I was surprised when the report opened with the statement, “Every year, 1.2 million people die in car accidents.” Technically, that’s true, but only 3.6 percent of them are in the United States.

According to Wikipedia (which is probably the source of the 1.2 million number), China sees 250,000 traffic fatalities per year. India is number two at more than 155,000. Despite the fact that all of Africa has only about 30 percent as many vehicles as the United States, Africa suffers 322,000 fatalities per year, with particularly high numbers in the Congo, Ethiopia, and Nigeria. Other counties with high fatalities include Brazil, Indonesia, Pakistan, Thailand, and Viet Nam. Continue reading

March 2025 Transport Results

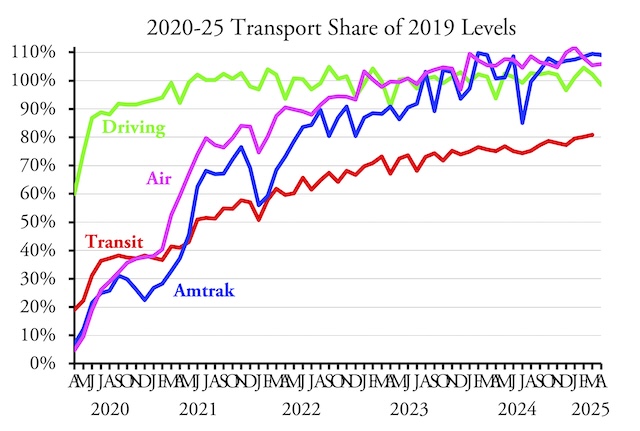
Amtrak boomed, carrying 21 percent more passenger-miles in March 2025 than the same month before the pandemic. The airlines carried 5.5 percent more passengers and highways carried 2.2 percent more vehicle-miles. As expected, transit continues to lag behind, carrying only 80.9 percent as many passengers as in March of 2019. That’s still the most since the beginning of the pandemic, but it is only 0.73 percent more (relative to 2019) than in February.

Amtrak data are from March monthly performance report; airline riders from Transportation Security Administration; highway vehicle-miles from the Federal Highway Administration, and transit data are from the Federal Transit Administration.

The transit industry is increasingly desperate to get more subsidies to offset the decline in ridership and the increase in operating expenses since 2019. Flush with Congressional COVID-relief funds, agencies increased salaries and wages and continued to operate nearly as many vehicle-miles of service despite the declines in ridership. Now the relief funds are running out and agencies that previously relied heavily on fares to fund their operations are getting panicky. Continue reading

February Driving 4.6% Greater Than in 2019

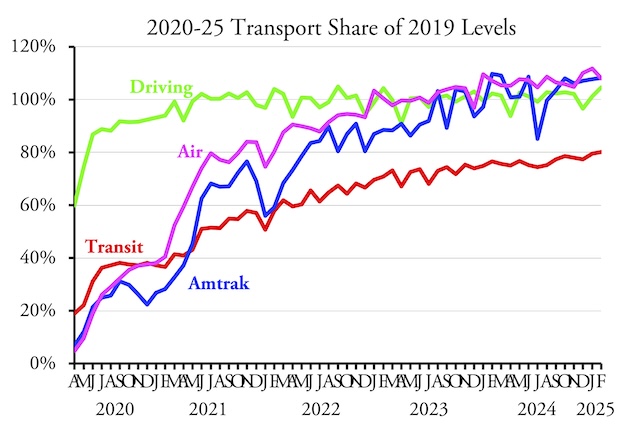
Americans drove 4.6 percent more miles in February 2025 than in the same month of 2019, according to data released yesterday by the Federal Highway Administration. Both urban and rural driving surpassed 2019 levels, as well as driving on all major types of roads: interstates, other arterials, and other roads. This is the first time since the pandemic that driving on all types of roads exceeded 2019 levels.

The February release presented some surprises. While February driving in Massachusetts was still less than 90 percent of pre-pandemic miles, Californians drove 5.5 percent more, Hawaiians 8.0 percent more, and Oregonians 7.0 percent more miles than in 2019. The only western states where driving fell short of 2019 miles were New Mexico, Washington, and Wyoming. Continue reading

January Driving Up 1.2% from 2019

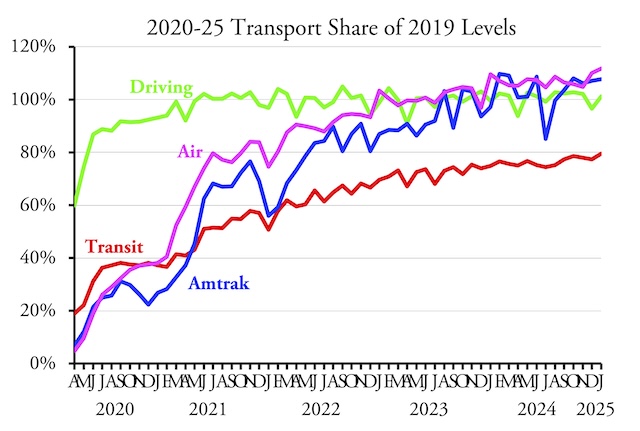
Americans drove 1.2 percent more miles in January of 2025 than the same month in 2019, according to data released by the Federal Highway Administration yesterday. These data were posted less than a week after the agency released December traffic volume data, which for some reason were later than usual.

The data show that rural driving was up by 4.1 percent while urban driving was up by 0.1 percent. While driving on urban interstates and collector and local streets was up, driving on major urban arterials other than interstates was down. Some of this difference may be due to the way the Federal Highway Administration collects its data, which concentrates more on interstates and other arterials than on local streets. In other words, the driving numbers on local streets may be overestimated. Continue reading

December Driving 96.6% of 2019

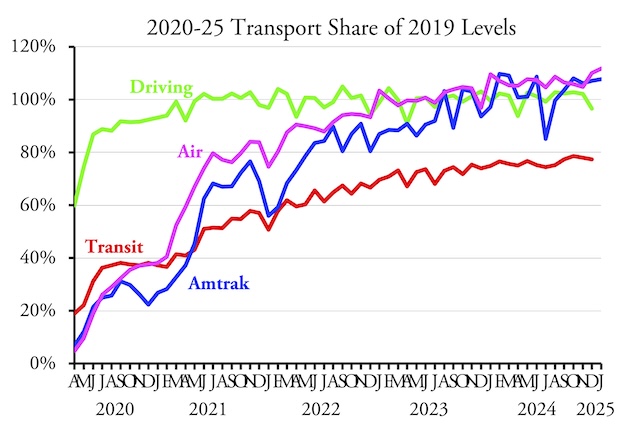
I guess Musk didn’t fire everyone at the Federal Highway Administration, as the agency finally released its December traffic volume trends indicating that Americans drove 3.4 percent fewer miles in December of 2024 than the same month in 2019. Driving over the entire year of 2024 was 0.6 percent greater than in 2019.

This compares with transit, which carried 76.5 percent as many riders in 2024 as it did in 2019. Amtrak carried 2.8 percent more passenger-miles and the airlines carried 7.2 percent more passengers in 2024 as 2019. Continue reading

Will Trump’s Electric Vehicle Order Kill EVs?

One of the executive orders President Trump signed on Monday calls for ending federal subsidies to and preferences for electric vehicles. With numerous media reports that EV sales were already tanking, some think that Trump’s order will kill the market for electric vehicles. It won’t, but it will shift things around.

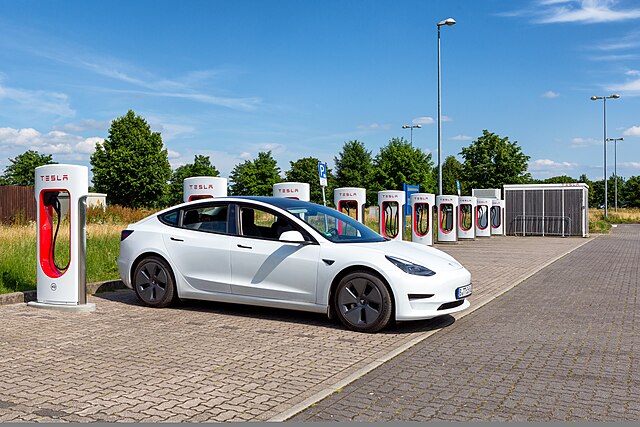
A Tesla Model S at a Supercharger station in Germany. Photo by Avda.

Curiously, Trump’s order is supported by Elon Musk. He claims he simply opposes all subsidies, but some think that he hopes an end to subsidies will benefit Tesla by discouraging other automakers from developing new electric vehicles. But there is a hidden cost to this order that could severely impact Tesla’s bottom line. Continue reading

City Auditor: Vision Zero Doesn’t Work

Portland adopted a Vision Zero plan in 2016. At first, it seemed to be working; at least, traffic fatalities declined from 42 in 2016 to 35 in 2018. The only problem is that few of the steps of the plan had been implemented by 2018, so that decline was merely a coincidence.

Click image to download a 2.1-MB PDF of this report.

The plan called for reduction of speed limits, stricter enforcement of speed laws, reconfiguration of dangerous intersections, and improved street lighting. Not everything was completed, but some of it was and the city saw a dramatic change in fatality rates — upwards. By 2022, the city had 62 fatalities; so far in 2024 it has had 69, so by the end of the year it is likely to be more than double 2018. Continue reading

September Driving 2.25% More Than in 2019

Americans drove 2.2 percent more miles in September 2024 than they did in the same month of 2019, according to data released by the Federal Highway Administration yesterday. September driving in rural areas was 7.9 percent greater but driving in urban areas was 0.2 percent less in 2024 than in 2019.

Amtrak has yet to release its September results, possibly because September is the last month of its fiscal year and it wants to get the year-end results right. When it does, I’ll post an update here.

Meanwhile, I discovered that I accidentally left the greenhouse gas emissions from some electric transit lines off of the enhanced spreadsheet I prepared of the 2023 National Transit Database. In going through the data, I also discovered some duplicate entries, which I deleted. If you downloaded my spreadsheet, which summarizes the 25-spreadsheet database into one worksheet, please download the corrected version now.

August Driving Nearly 103% of Pre-Pandemic Miles

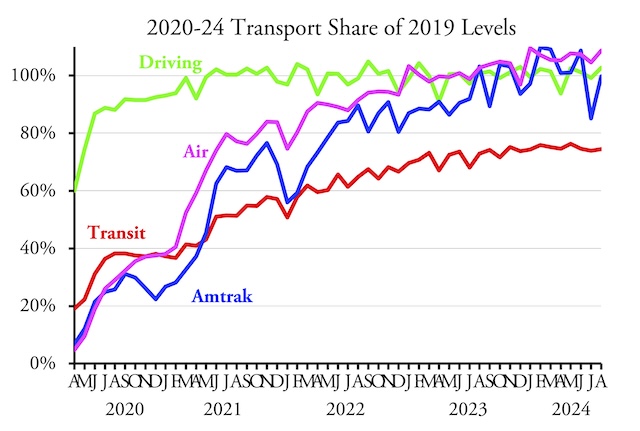
Americans drove 102.7 percent as many miles in August of 2024 as in the same month of 2019, according to data released yesterday by the Federal Highway Administration. Moreover, this is the first month I can remember since the pandemic began that driving exceeded pre-pandemic numbers on all types of roads, including urban and rural interstates, other arterials, and other roads.

For a discussion of Amtrak and airline data, see this post. For a discussion of transit data, see this post.

August 2024 driving was greater than 2019 driving in 28 states, while it was less in 22 states plus DC. DC driving was slightly less than 80 percent of 2019 miles, and miles of driving were also particularly low in Delaware (82%), Hawaii (84%), West Virginia (86%), and Massachusetts (88%). Continue reading

July Driving 99.2% of 2019

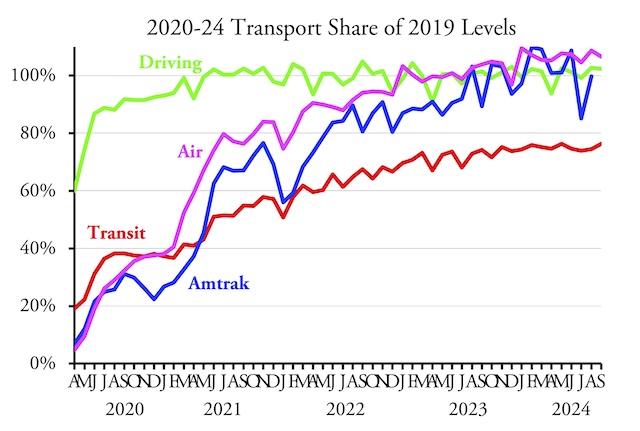
Americans drove 99.2 percent as many miles in July 2024 as the same month in 2019, according to data published by the Federal Highway Administration yesterday. This is one of the few times that monthly highway traffic data have been released before transit ridership data.

July transit data are not yet available.

Except in April 2024, when driving dipped below 94 percent of pre-pandemic levels, miles of driving have been 99 percent to 103 percent every month for the last year. As usual, rural driving was more: 3.5 percent above 2019, while urban driving was 2.8 percent less than in 2019. However, driving on urban interstates grew 1.4 percent.