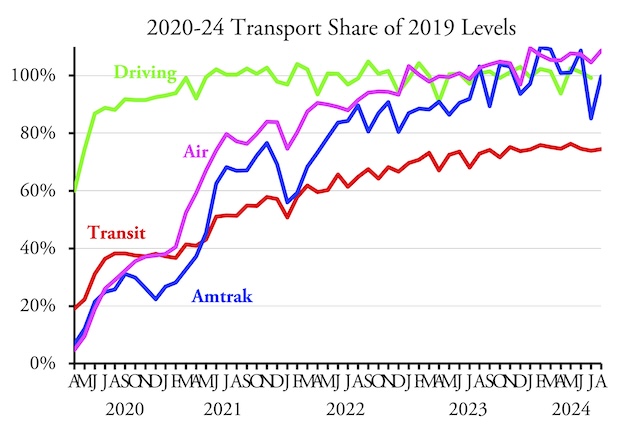
America’s transit systems carried 25.5 percent fewer riders in August of 2024 as in the same month of 2019, according to data released by the Federal Transit Administration last Friday. Transit ridership has hovered around 75 percent of pre-pandemic levels since November 2023.
I previously reported that July transit ridership was only 71.1 percent of 2019, but warned that several major transit agencies had not yet submitted July numbers. Those agencies, I estimated, made up about 2.5 percent of U.S. transit ridership so I guessed that the real number would be 73.6 percent. I was off by a bit: all major agencies have report July numbers and July ridership was 73.9 percent of 2019.
Since some data were missing from previous reports as well, I used the latest data to correct past numbers and found that ridership has has exceeded 75 percent of 2019 levels in four months since the pandemic: November of 2023 and February, March, and May of 2024. To adjust for leap day, I multiplied February numbers by 28/29. Since March, incidentally, days of the week in the months of 2024 have been identical to those of 2019 so the number of business days doesn’t influence differences of ridership.
May ridership slightly exceeded 76 percent of May 2019, making it the highest, relative to before the pandemic, of any month yet. June, July, and August ridership fell back below 75 percent. While there may still be a few minor corrections to be made, I don’t expect them to significantly change these results.
As usual, I have posted an enhanced spreadsheet. The FTA raw data are in cells A1 through JV2291; annual totals are in columns columns JW through KS; national and mode totals are in rows 2300 through 2319; transit agency totals in rows 2330 through 3329; and urban area totals in rows 3331 through 3821. Column KT compares August 2024 with August 2019, column KU compares 2024 to date with the same months in 2019, and for some rows KV compares July 2024 with July 2019. These totals can be found on both the ridership (UPT for unlinked passenger trips) and service (VRM for vehicle-revenue miles) worksheets.


Total spending on transit in 2023 was close to 80 Billion dollars
Total Road spending was around 200 Billion.
Except Transit accounted less than 1% modal share transportation usage in 2019 by 2023 was down to 0.05%?
Transit gets 1/3 nations transport dollars to move less 1/200th nations passenger volume, subtract NYC/NJ/Long Island area it’s 1/400th it’s literally cheaper to bus them in rolls royces
For the first time in recorded history, three hurricanes at once are happening in the Gulf of Mexico. Enjoy fire season next year in Oregon, AP! But don’t worry, we all agree with you that the science is not definitive that global warming due to manmade carbon emissions is even real.
You’re citing a weather event, about which we need a citation, to try to establish man made global warming?