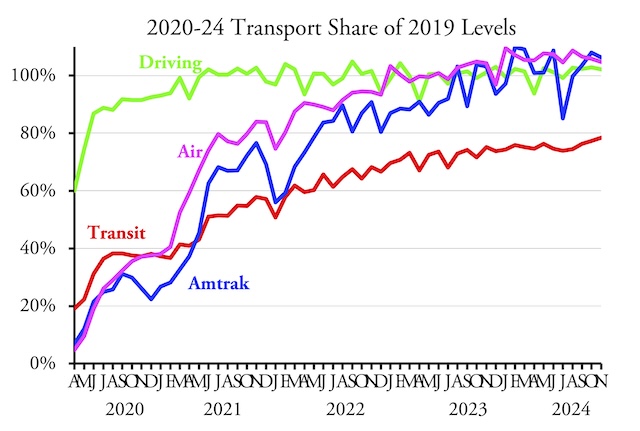
Americans drove 2.2 percent more miles, flew 4.7 percent more trips, and took Amtrak 6.2 percent more passenger-miles in November 2024 than the same month before the pandemic, according to data recently released by federal agencies. Transit ridership, however, still lagged almost 22 percent behind pre-pandemic numbers.
For once, the Federal Highway Administration, Federal Transit Administration, and Amtrak all released their monthly data reports at about the same time, late last week. TSA passenger counts are available only a day or two after each day, but I generally wait for data from other agencies before posting the airline data.
A commenter recently criticized me for using passenger-miles for some modes and passenger counts for others. As I’ve explained before, I prefer to use passenger-miles for all passenger transport, but the Federal Transit Administration only releases those once a year and the Bureau of Transportation Statistics releases airline passenger-miles a couple of months after data are available for other modes. The numbers for September 2024 show flights to and from U.S. airports carried 2.3 percent more passenger-miles than in September 2019.
The Federal Highway Administration estimates passenger-miles by estimating the share of vehicle-miles attributable to cars, light trucks, motorcycles, buses, and heavy trucks, and then multiplying each category by a factor, most of which are calculated from the semi-decennial National Household Transportation Survey. The most recent survey estimated that this averages across all categories to 1.58 people per vehicle. Multiplying the vehicle-miles used to calculate the numbers for the above chart by 1.58 to get passenger-miles would result in no changes to the chart.
What is notable is that Americans drove almost 10 percent more miles in rural areas but almost 1 percent fewer miles in urban areas in November of 2024 than the same month in 2019. At least some of this change is due to movements of people from urban to exurban or rural areas.
As usual, people interested in looking up transit data for individual agencies or urban areas can download my enhanced spreadsheet presenting the FTA’s raw data and calculating totals by year, mode, transit agency, and urban area. On the trips (UPT) and service (VRM) worksheets, the raw FTA data are in cells A1 through JY2302, with annual totals for 2002 through 2024 (to date) in columns JZ through KV, mode totals in rows 2310 through 2331, transit agency totals in rows 2340 through 3339, and urban area totals in rows 3341 through 3831. Columns KW through KY compare November 2024 with November 2019, the years to date, and November 2024 with November 2023.


