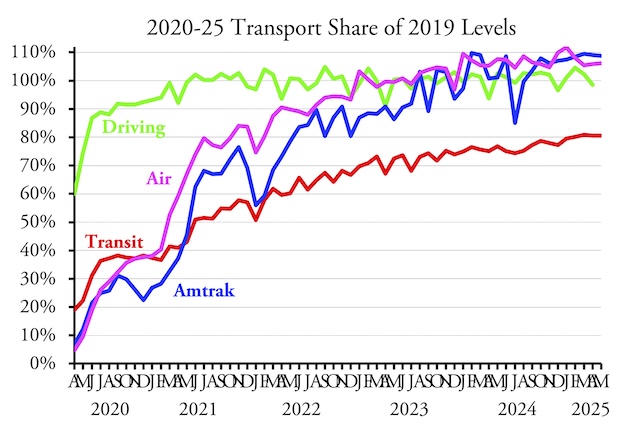
America’s public transit systems carried 80.6 percent as many riders in May of 2025 as the same month before the pandemic, according to data released last week by the Federal Transit Administration. That’s about the same percentage as in April; though a stickler (like me) would point it that it was three ticks lower as May was 80.58 percent while April was 80.61 percent.
May highway data will be presented here soon.
Transit’s overall ridership is boosted by New York, where nearly half of all transit ridership takes place and where May ridership was 86.4 percent of May 2019. I probably don’t need to do a roll call of urban areas where transit was above average, but transit officials in Chicago (68%), Atlanta (59%), Phoenix (57%), Denver (59%), St. Louis (57%), and Pittsburgh (57%) must be particularly nervous. Memphis cut the budget of its transit agency, forcing the agency to reduce service to 66 percent of 2019 levels, with the result that ridership was only 37 percent of that prior to the pandemic. Other cities and regions are contemplating similar cuts.
Some people have asked me why I hate transit so much. The answer is that I don’t hate transit so much as I hate subsidies. I also hate the fact that transit industry has such good public relations that it has convinced people not to look at the subsidies. This has allowed the subsidies to go out of control.
A recent article from a Honolulu news agency noted that the Honolulu Area Rapid Transit agency carried 1.2 million riders in fiscal year 2025 (which ended June 30) at an operating cost of $89.2 million. That’s $74 per ride before even considering the nearly $10 billion in capital costs sunk into the rail line. The author of the article probably didn’t make this calculation or bother to note that fares are nominally just $3 (but with passes probably average a lot less). Instead, the author dismissed any concerns about subsidies by saying, “Transit systems, like highways, are always heavily subsidized.”
Actually, some transit systems and many highways are not subsidized at all. In general, the Interstate Highway System was paid for almost entirely out of user fees and state highways in most states are also paid for through fuel taxes, vehicle registration fees, and tolls. Local road maintenance is subsidized, and I’d like to end those subsidies, but the subsidies average around a penny per passenger-mile, while the subsidy to the Honolulu rail line is in the tens of dollars per passenger-mile (again, not counting capital costs).
I also hate the fact that transit is so heavily subsidized that agencies don’t even care about carrying passengers anymore because passengers contribute so little to transit’s bottom line. I’ve been looking at one major city (report to come out soon) whose downtown has less than 2 percent of the region’s jobs but which has nine edge cities that each have more jobs than downtown. The city’s transit agency is busy building rail lines into downtown and neglecting service to the edge cities. The largest edge city has twice as many jobs as downtown, yet less than half a percent of the people working there take transit to work.
I further hate the fact that the fixation many transit agencies have on rail transit has made transit unable to respond to changes in travel habits, of which the pandemic is only the most obvious example. The city mentioned above has one of the nation’s largest shopping malls, and fifteen years ago people thought the area around it would turn into an edge city. The transit agency spent years planning and building a rail line to the mall and completed it last January — three-and-a-half years after the mall closed because people don’t shop in malls anymore. There are still some jobs in the area, but it will never turn into an edge city like people once thought.
For all these reasons, I want all transit agencies to have the same future that Memphis is going through now. Maybe it will teach them to actually serve customers and not just politicians.
As usual, you can download my enhanced version (22.2MB) of the FTA spreadsheet. This includes annual ridership totals from 2002 to date, plus totals by mode, agency, and urban area for both ridership and vehicle revenue miles of service.


