“Rural schools in California already struggle with declining enrollment, staffing shortages and wildfires,” says Carolyn Jones, writing for Calmatters, a left-leaning policy web site. “Now they’re facing the possible loss of money they’ve relied on for more than a century.” What Jones doesn’t say is that the counties have been scamming federal taxpayers for that money for decades and they’d naturally rather continue the scam than have to raise the money locally.
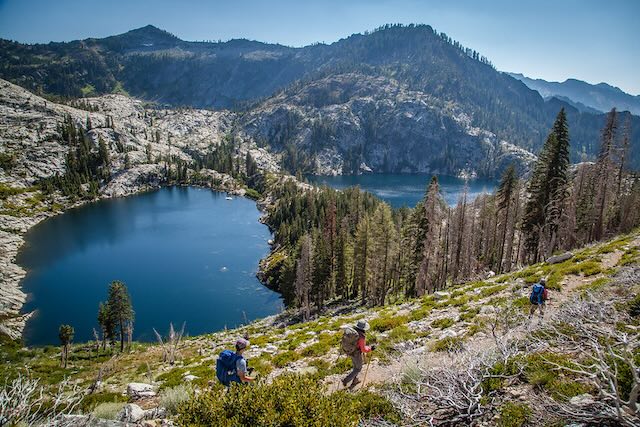
No children live in the Trinity Alps Wilderness Area, which imposes no costs on the Trinity Alps School District. Yet the school district superintendent somehow finds it “mind boggling” that Congress might not force federal taxpayers to pay the district for every acre of wilderness area and other national forest lands that happens to be in Trinity County, California. Photo by Kee Yip.
Federal lands aren’t taxable by state or local governments. When Congress began setting aside national forests, it decided to make it up to local governments by giving them 25 percent of any revenues the forests earned. In some places, the counties got 50 percent. Congress specified that national forest payments to counties had to be spent on roads and schools. Continue reading

 The official portrait of Mayor Goldschmidt.