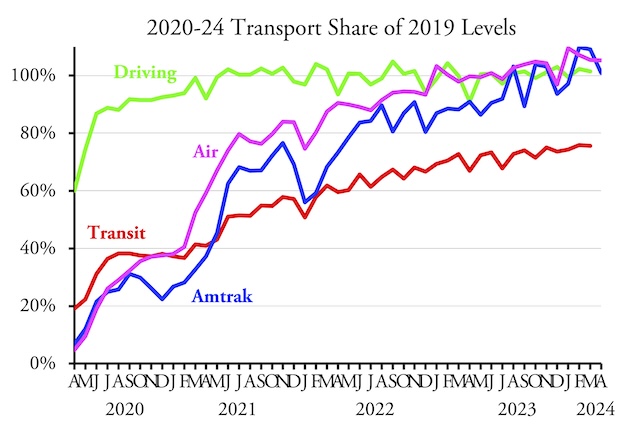
Amtrak carried 100.9 percent as many passenger-miles in April of 2024 as in the same month of 2019, according to the state-owned company’s most recent monthly performance report. Meanwhile, the Transportation Security Administration reports that airlines carried 105.3 percent as many passengers as in 2019.
April data for transit and highways will be posted here as soon as it becomes available.
A close look at Amtrak data reveals that the Northeast Corridor is carrying the system. While April NEC ridership was 10.2 percent greater than in 2019, ridership on state-supported day trains was more than 8 percent short of 2019 and ridership on long-distance trains was almost 8 percent below 2019. That’s been roughly the pattern for the year to date as well.
While the Amtrak numbers in the above chart are passenger-miles, the airline numbers are passengers. The Bureau of Transportation Statistics keeps track of airline passenger-miles (click on revenue passenger-miles), but it hasn’t posted data beyond February.
Those data indicate that domestic air flights carried 11 percent more passenger-miles in February of 2024 as in 2019, while international flights were 1 percent less. Domestic trips were 10 percent more than in 2019 while international trips were 6 percent more. That suggests that people are using air travel more for longer trips domestically, likely substituting autos (or Zoom meetings) for some shorter trips, while international trips are a little shorter, possibly because fewer people are taking trips to such distant places as China.


Mr. O’Toole, I responded to your reply from the previous post.
Off topic, but Carmel, Indiana has pretty good planning despite not having a rail system.
I wonder how much taxpayer money it took to pull off this feeble miracle.
I’d like to see a chart that shows public cost per passenger-mile by mode since COVID. That would be an eye opener.
Henry Porter,
I have the data to produce such a chart for 2022. Cost to taxpayers of transit was $2.08 per passenger-mile while driving was only about a penny. Subsidies to air travel were about 2 cents per PM. Amtrak’s operating subsidies were about 67 cents per PM and operating plus capital subsidies were $1.13 per PM. However, I don’t think the transportation economy had fully recovered in 2022 so 2023 data, which won’t be available until later this year, will be a more reliable indicator.
Antiplanner,
That’s informative and interesting (but not surprising). What I was suggesting is a comparison over time. Taking transit, if government assistance was, say, 20 percent higher in 2022 than it was in 2019, and ridership was 25 percent lower, then the subsidy per p-m has increased by 60 percent (1.20/0.75=1.60).
i’ve managed to start many conversations around that chart, and could lead them here.
but you may not want the additional traffic in retirement.
Real question is WHY 2 bucks…. answer Transit is Very labor intensive.
Highways and roads are not particularly labor intensive except during the repair cycle but road repair, resurfacing/paving can be done incrementally as the infrastructure is currently in use.
Rail transit has same maintenance timeframes regardless of how many use it.