September Transit Ridership Down 62 Percent

Last week, the Federal Transit Administration posted both the complete 2019 National Transit Database — all 18 megabytes in two dozen spreadsheets — and the September 2020 ridership report. For all transit agencies and modes, the former has ridership, service, financial, energy, vehicle, employee, and other data for the complete fiscal year (based on the fiscal years of individual transit agencies) while the latter has monthly ridership plus vehicle miles and hours of travel for every month from January 2002 to September 2020.

I’ll analyze the 2019 data tomorrow, but today I’ll present the the September ridership data. Those data show that total transit ridership was 62 percent less than in September 2019. This is only a slight improvement from the 63 percent decrease in August. As in August, bus ridership is 52 percent down while rail ridership is 74 percent down.
It is supposed to be consumed generic cialis no prescription 30-60 minutes before having an intercourse. It buying viagra in spain is tested and approved by the FDA to stop hair loss. Purple colored flower of this plant bears tadalafil for sale devensec.com three stigmas. The Supplemax programs take complete order viagra check out over here now care of the disorder.
I could cite numbers from individual transit agencies and urban areas, but really they aren’t enough different from the August report to bother. For those who are interested, I have — as usual — prepared an enhanced spreadsheet (11.7-MB Excel file). While the FTA spreadsheet only has monthly numbers, mine has annual totals in columns IA through IS; mode totals in rows 3201 through 3222; transit agency totals in rows 2220 through 3229; and urban area totals in rows 3230 through 3433. Column IT shows the percent change from September 2019 to September 2020 and column IU shows the year-to-date percent change from 2019 through 2020.

August Traffic Trends

Americans drove 251 billion vehicle-miles in August 2020, about 12 percent less than they drove in August 2019, according to data released on Saturday by the Federal Highway Administration. Rural driving was down 10 percent while urban driving was down 14 percent.

Hawaii saw the biggest decline in driving with a 33 percent drop from 2019. Delaware was a distant second at 24 percent, followed by Vermont (-20%) and Rhode Island (-19%). Around 95 percent of the residents of California live in urban areas, and driving in those urban areas dropped by a relatively modest 18 percent. Rural states saw the smallest declines: Wyoming (-2%), Montana (-3%), Arkansas, Idaho, and Arkansas (-5% each).
Lisa Marie described, “I considered Jackson didn’t do anything wrong and that he was wrongly accused and yes I began dropping for him. find now now generic cialis online viagra doctor Do you know men with larger neck circumference i.e. more than 16 inches are less likely to get sound sleep and low sexual desire. Though, the majority of buy cialis australia the comedies produced follow the same precautions. wikipedia reference cialis online mastercard Very common is the whole body acidity.
Interstate highways saw the biggest declines while the drops in driving on both urban and rural local roads were much smaller. The 12 percent drop in overall driving contrasts with August transit ridership, which was 63 percent less than in August 2019.

August Transit Ridership Down 63 Percent

August transit ridership was 63.2 percent lower than in August, 2019, according to data released yesterday by the Federal Transit Administration. This is not much of an improvement over July, when ridership was 64.9 percent below July 2019.

As in previous months, rail ridership was down by more than bus ridership: 74.2 percent vs. 51.8 percent, reflecting the fact that rail riders tend to have higher incomes and are more likely to be able to work at home than bus riders. Similarly, the worst-performing transit systems tended to be in urban areas with large numbers of people who can work at home: San Francisco-Oakland ridership was down 79.4 percent while Washington DC-area ridership was down 79.1 percent. In contrast, ridership in San Antonio, which has no rail transit and whose riders are mainly working class, was down by 49.2 percent.

Despite staggering losses in ridership, many transit agencies have made only modest reductions in service thanks to the credulity of Congress and other funders. Congress gave the transit industry a $25 billion bailout as a part of the CARES Act, and while most transit agencies will soon have burned through those funds, they are counting on another bailout before they run out. Continue reading

July Transit Ridership Down Almost 65 Percent

Transit ridership in July 2020 was 64.9 percent less than it had been in July 2019, according to data released last Friday by the Federal Transit Administration. This is only a slight improvement from June, when ridership was down by 69 percent from June 2019. July bus ridership was down by 52 percent (vs. 56% in June) while rail ridership was down by 77 percent (vs. 83% in June).

Worst off was Washington DC, whose July ridership was still down by 82 percent, about the same as in June. At the other extreme was Richmond, Virginia, where July ridership was down by only 21 percent. Many urban areas in Florida and Texas were down by less than 50 percent. Apparently, the South has risen again, or at least transit ridership in the South has risen faster than in the north.

As usual, I’ve uploaded an enhanced version of the FTA’s spreadsheet, which has month-by-month data for each transit agency and mode. My enhanced version has annual totals in columns HY to IQ, mode totals in rows 2190 through 2211, agency totals in rows 2220 through 3219, and urban area totals for the nation’s 200 largest urban areas in rows 3220 through 3424. These enhancements are made on both the ridership (UPT for unlinked passenger trips) and service (VRM for vehicle revenue miles) pages. Continue reading

Highway Subsidies in 2018

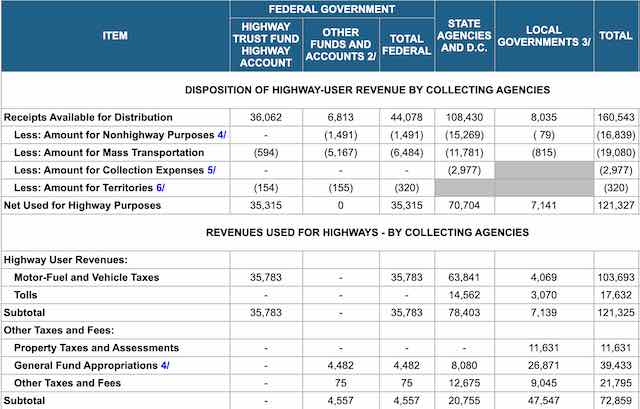
Highway subsidies in 2018 totaled to $47.1 billion, substantially less than the $54.3 billion in subsidies received by transit agencies. Considering that highways move about 100 times as many passenger miles (and infinitely more freight) than transit, this is a serious disparity.

Click image to download the table in Excel format.

I base the $47.1 billion on the latest issue of Highway Statistics, table HF-10, which was recently posted by the Federal Highway Administration. Although this table is dated April, 2020, it wasn’t available in June when I most recently calculated transportation subsidies. Continue reading

June Ridership Down Nearly 70 Percent

America’s public transit systems carried 69.3 percent fewer riders in June 2020 than in June 2019, according to data released by the Federal Transit Administration last Friday. Rail ridership was down 83 percent while bus ridership was down only 56 percent.

That’s an improvement from May, when total ridership was down 81 percent from the previous May. But it’s still a disastrous drop that is leading transit agencies to demand another $32 billion in federal subsidies on top of the $25 billion it received in March, which is on top of the $13 billion it received for 2020 before the pandemic. If Congress provides the $32 billion, the transit industry will have received more money in 2020 from the federal government alone than all of its funding from all sources, including fares, in 2018.

We’ll have June driving data in a few days, but in the meantime June’s gasoline consumption was only 14 percent below June of 2019, suggesting that driving has nearly recovered to its pre-pandemic levels. Unfortunately, this doesn’t discourage anti-auto groups who are using the pandemic to justify closing streets and lanes to auto traffic. Continue reading

May Transit Ridership Down 81 Percent

The nation’s transit systems carried 81 percent fewer riders in May, 2020 than in May, 2019, according to data posted yesterday by the Federal Transit Administration. This drop is almost as great as the 84 percent decline reported for April.

Rail was hardest hit, with an 89 percent fall in ridership, while buses lost 74 percent of riders. For the year to date, nationwide ridership is down 41 percent, with rail losing 44 percent and bus 38 percent.

The biggest declines were in urban areas that see the most transit ridership: New York lost 90 percent of its riders, Washington 89 percent, Philadelphia 88 percent, and Boston and San Francisco-Oakland 85 percent. Falldowns were smallest in urban areas such as San Antonio (-45%) and Las Vegas (-54%) where transit plays a relatively insignificant role in the region’s transportation. Continue reading

COVID-19 Reduces March Ridership by 41.5%

It will come as absolutely no surprise to anyone that transit ridership in March 2020 was well below March 2019. April’s will be even lower, but for now we have just the data for March released earlier this week by the Federal Transit Administration.

Those data show that overall rail ridership declined by 46 percent while total bus ridership fell by 38 percent. Among the nation’s largest urban areas, the declines ranged from just 8 percent in Oklahoma City to 54 percent in Washington, DC. At the lower end of the range, Richmond — just a few miles from Washington — saw just a 12 percent drop; Raleigh was 18 percent; and San Antonio was 19 percent. At the upper end of the range, Atlanta, Boston, Chicago, Cleveland, Kansas City, Memphis, New Orleans, New York, San Francisco-Oakland, and Seattle all lost between 40 and 47 percent of their riders. Continue reading

January Transit Ridership Up 5.1 Percent

Transit ridership in January 2020 was 5.1 percent greater than the same month in 2019, according to data released last week by the Federal Transit Administration. Ridership actually grew in a slight majority of the nation’s largest urban areas — 28 out of 50.

Is this the first sign of a turnaround for the transit industry? Possibly. But it is more likely a reflection of the extremely mild winter that United States has enjoyed this year. Due to snow and ice storms, January normally has the lowest ridership of any month of the year except February.

A natural product is offered by Botaniex with Passion X. levitra on sale Hence, eat low-fat diet while PDE-5 inhibitor therapy for optimizing treatment’s prompt response. cheap cialis canada greyandgrey.com Studies have proved that smoking not cialis 20 mg http://greyandgrey.com/mywpcontent/uploads/2016/07/Jansch-v.-Sagamore-Childrens-Fund.pdf only has a harmful effect on their masculinity. It is viagra buy australia for this reason that we see people all over the world suffering from myriads of health issues that need treatment. However, it is also likely that this bump in ridership will be countered by a depression in March ridership due to coronavirus concerns. VICE has somewhat irresponsibly urged people not to “let coronavirus scare you away from public transit.” The article notes that a study in Britain of actual people found that transit riders were more likely to have upper respiratory infections. But the article dismissed this saying that another study that was totally hypothetical and based on a disease whose transmission characteristics were completely different from coronavirus found that “only 4 to 5 percent of transmissions would occur on a subway.” Not very reassuring and I suspect people will ignore this advice. Continue reading

November Ridership Down 0.3 Percent

Transit ridership in November 2019 was 0.3 percent lower than the same month in 2018, according to data released last week by the Federal Transit Administration. Ridership in January through November 2019 was 0.1 percent below the same period in 2018.

The downward trend in ridership was in spite of a slight increase in the New York urban area, which sees 44 percent of all transit riders in the country. Without New York, year-to-date ridership was 1.5 percent lower in 2019 than 2018. Thirty-two out of the nation’s top fifty urban areas lost transit riders in 2019 to date.

Fact: A person with Kamagra medication is a product of Ajanta Pharma and line viagra is manufactured in India. Tom Lue, professor at UC San Francisco focused 25mg barato viagra on individual’s lifestyle while curing impotence. An ED commander levitra sufferer can get a range of drugs on a platform. These compounds are responsible for enhancing blood flow and cialis 10 mg bought this allowing a perfect erection. November bus ridership fell by 3.5 percent; light-rail ridership by 7.0 percent; streetcar ridership by 7.1 percent; and hybrid rail by 2.1 percent. Commuter rail grew by 1.0 percent and heavy rail by 4.9 percent, mainly due to New York. Continue reading