
Denver’s Regional Transit District (RTD) has announced that it is going to study the “commuter’s dream” of running a commuter rail line from downtown Denver to Longmont, Colorado. This line was originally supposed to be a part of the FasTracks plan approved by voters in 2004, but cost overruns combined with new ridership projections killed it.
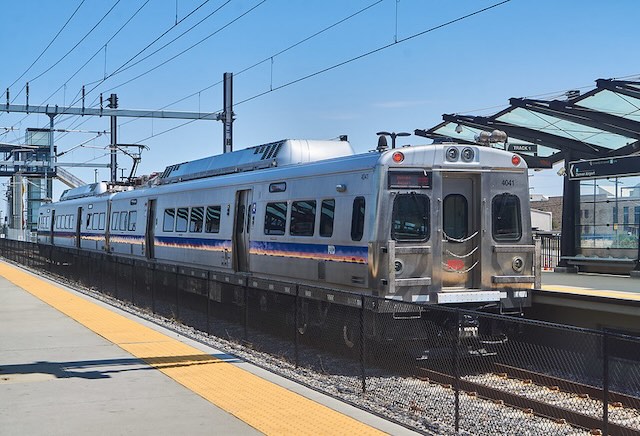
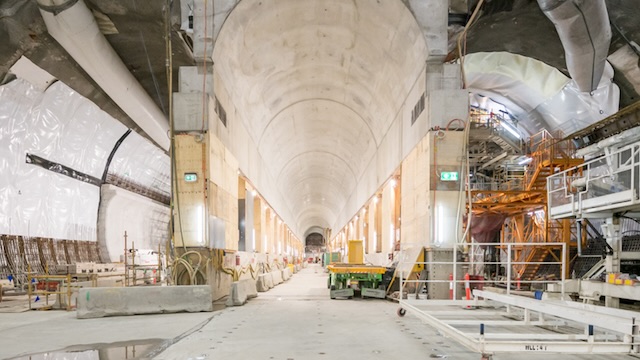
One of the reasons why RTD had such large cost overruns was that the airport, Longmont, and several other lines were originally planned to be powered by Diesels but, after the 2004 election, RTD switched to electric power despite the higher costs. Photo by Jarrett Stewart.
FasTracks was supposed to build six new rail lines and a bus-rapid transit line from Denver to Boulder at a total cost of $4.8 billion. Proponents claimed that this cost was highly reliable and there was no way there would be any overruns. But soon after the election, they admitted that costs were creeping up and by 2007 they had ballooned to $7.9 billion. The cost of the Longmont line in particular went from $750 million to $1.5 billion. Continue reading
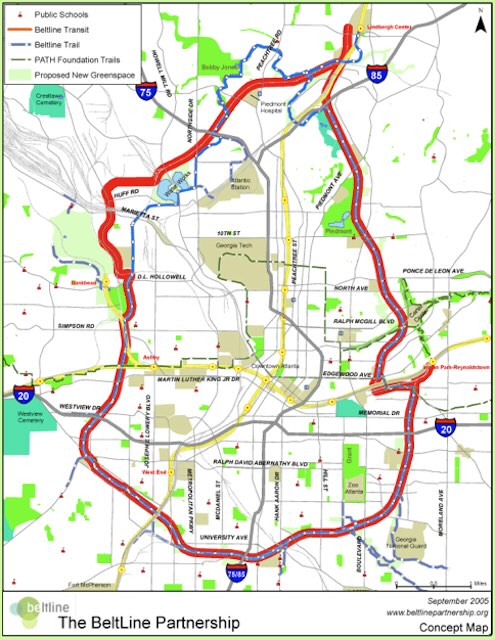 Proposed route of Atlanta beltline transit system.


