
America’s transit industry has been heavily criticized for spending so much on construction. Yet the industry continues to roll up cost overrun after cost overrun for projects that should have been too expensive to build in the first place.
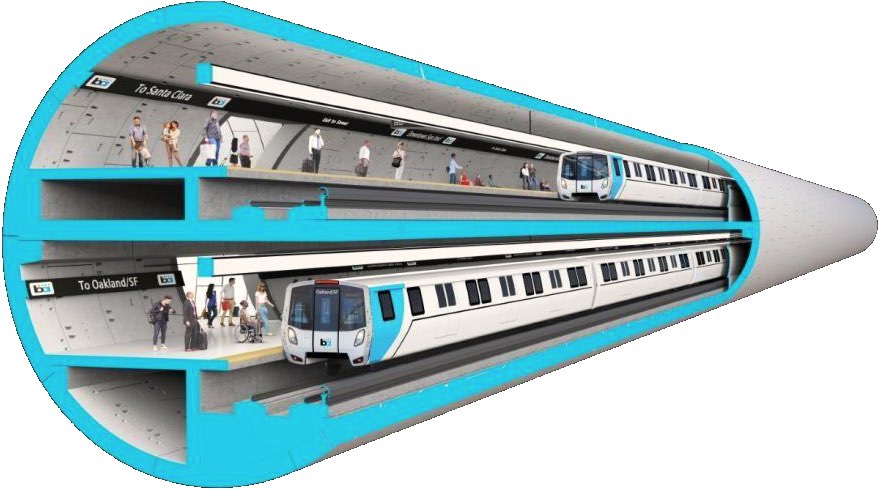
VTA’s planned single-bore tunnel into downtown San Jose. Figure by VTA.
Take, for example, the BART line to San Jose, which is being planned and built by the Santa Clara Valley Transportation Authority (VTA), which has never displayed much competence in the past. Rather than cut and cover two small tunnels into downtown San Jose, which is the usual practice, VTA wants to bore one gigantic tunnel three to four stories underground. The 6-mile line was originally projected to cost $4.1 billion, but last October the Federal Transit Administration (FTA) announced that it expected the cost to be $9.1 billion, or $1.5 billion a mile, and the agency expressed doubts that VTA had the funds to cover this cost overrun. Continue reading


