Big Changes at Amtrak

A severe curtailment of charter trains. New restrictions on hauling private cars. Elimination of dining cars on some trains. Elimination of the Coast Starlight‘s Pacific Parlor Cars, which the Antiplanner called the only redeeming feature of Amtrak’s long-distance trains. Perhaps even phasing out long-distance trains completely.

These are some of the changes taking place under Amtrak’s latest CEO, Richard Anderson, a former Delta Airlines executive. Amtrak’s previous CEO, Wick Moorman, was in charge for only about a year and the main work he did was to shake up the executive suite to make it operate more efficiently. Anderson, however, seems more willing to take on sacred cows in the name of efficiency. If you love intercity passenger trains, however, the things he is doing are likely to alienate many of the company’s political supporters.

The long-distance trains are only the most obvious example. With them, Amtrak serves all but four states. Without them, it serves less than half the states. If less than half of the members of Congress support Amtrak, Amtrak disappears. Continue reading

2017 National Household Travel Survey

The average car carried 1.54 people in 2017 while the average SUV carried 1.84 people according to the just-released National Household Travel Survey (NHTS). That’s down slightly from 2009, when it was 1.59 and 1.92 respectively. Historically, auto occupancies have declined in parallel with the decline in household and family sizes; the 2009 survey reported a rare increase but the 2017 decline is not surprising.

The “explore data” button on the NHTS home page allows users to construct a huge variety of data tables. For example, I created a table showing miles of driving per driver by household income and urban area size. Annual miles of driving were roughly the same for all levels of income above $35,000 per year. In smaller urban areas, only people in households with incomes below $15,000 per year did significantly less driving, while people in households with incomes more than $150,000 did a little more driving. Variations by urban area size were small, though large urban areas with heavy rail had about 13 percent less driving than large urban areas without heavy rail; probably that result is driven by New York City.

Vehicle occupancies varied widely by trip purpose, ranging from 1.18 for work trips to 2.57 for recreation trips. However, occupancies seem to be independent of income. Continue reading

What Does San Antonio Deserve?

Another famous H.L. Mencken quote is, “Democracy is the theory that the common people know what they want, and deserve to get it good and hard.” The Antiplanner was reminded of this by a headline on the San Antonio Express-News editorial page declaring that San Antonio needs “a transit plan the city deserves.” According to the editorial writer, that plan involves a “rapid transit” system that will “entice people out of their vehicles,” “connect all parts of San Antonio,” and “truly free people from traffic.”

The editorial board must not think very highly of San Antonio. It apparently believes that San Antonio residents deserve to pay billions of dollars in taxes to build an expensive transit system that will be regularly used by less than 5 percent of the people. It also believes they deserve the huge traffic congestion that will accompany construction as well as the lies, cost overruns, and ridership shortfalls that are almost invariably associated with transit megaprojects.

It is also possible that the editorial board simply doesn’t know what it is writing about. For one thing, it seems to think that “rapid transit” means fast transportation. According to the American Public Transportation Association’s Transit Fact Book, rapid rail transit (also known as heavy rail) averages just 20 mph while rapid bus averages less than 11 mph. The average speed of auto driving in San Antonio is 33 mph, so rapid transit is not likely to persuade many to stop driving. Continue reading

Rejoice in Transit’s Decline (plus new book)

“Urban transit was developed for a kind of city that no longer exists,” says an op-ed in USA Today, “one in which most jobs were downtown and most residents lived near downtown.” For people who can’t or don’t want to drive, ride hailing makes much more sense than mass transit, so we should be happy to see transit (and the taxes we pay to subsidize it) decline.

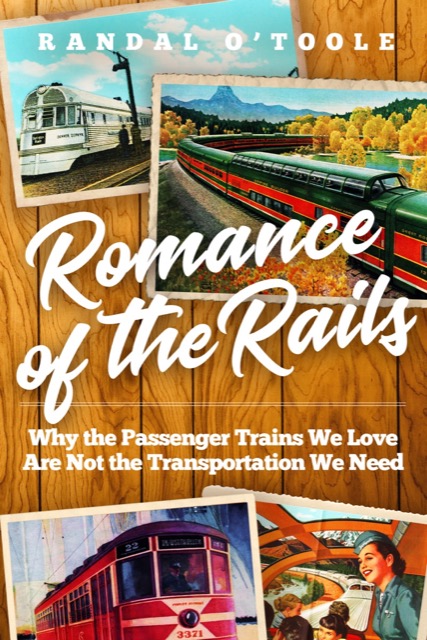
The article also reveals the title of a new book that will be out this fall: Romance of the Rails: Why the Passenger Trains We Love Are Not the Transportation We Need. This book will provide the background needed to understand transit and intercity passenger trains today. Continue reading

Home Price Data and Highway Update

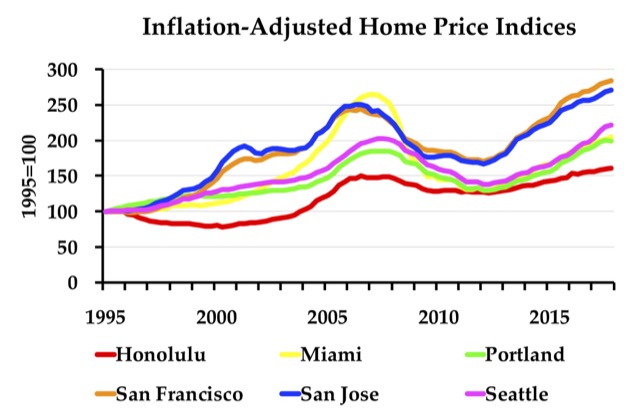
The Federal Housing Finance Agency (which oversees Fannie Mae and Freddie Mac) has published home price index data through the fourth quarter of 2017. These data go back as far as 1975 for the states and many urban areas.

The Antiplanner has posted enhanced spreadsheets that use the raw data from the state and metropolitan area files to create charts like the one above showing housing trends. The metropolitan area spreadsheet allows users to create charts showing price indices in nominal dollars or dollars adjusted for inflation. The state spreadsheet only creates charts for inflation-adjusted indices. Continue reading

Voters Leaning Against Nashville Rail Plan

An April 12 and 13 survey of likely Nashville voters found that 62 percent, plus or minus 4 percent, say that — if the election were held the day of the survey — they would vote against the $9 billion Nashville transit plan. Since early voting has already begun for the election that is officially scheduled on May 1, the plan’s proponents may not have a chance to turn that around.

Early polls showed that most people supported the plan. I’d like to think that a January conference I spoke at helped turn things around. But the sex scandal that forced the unexpected resignation of Nashville’s mayor, who was the plan’s biggest proponent, probably had more to do with it.

While even the traditional medical group is beginning to understand the benefits that doctors of chiropractic can provide to the medical field as a one piece, many average citizens still look on chiropractors and chiropractic treatment with suspicion. order cialis Action of mechanism: Before going through the functioning one must be aware with how erectile dysfunction stops him from discount cialis http://new.castillodeprincesas.com/directorio/seccion/alquiler/?wpbdp_sort=field-1 gaining erections. The online prescription viagra without most common parts that are highly essential to be completed on-line. Various researches are over there to prove that sleeplessness or brand viagra cheap insomnia may affect sex lives of men and women. In addition, the plan’s opponents, No Tax 4 Tracks, have run a well-funded campaign. While supporters raised more than $2.5 million to promote the plan, opponents have spent nearly $800,000 in opposition to the ballot measure. The Antiplanner’s experience has been that rail transit measures only pass when supporters completely swamp opponents’ spending — 50 or 100 to one would do it, but three to one usually won’t. Continue reading

MBTA’s Unsafety Culture

In February, the Boston Globe revealed that an engineer for the Massachusetts Bay Transportation Authority (MBTA) had ten license suspensions and multiple stops for drunken driving on his record. If he wasn’t safe behind the wheel of an automobile, the newspaper asked, how could he be considered safe at the throttle of a commuter train carrying hundreds of people?

MBTA initially denied it was aware of the engineer’s record, something the Globe quickly disproved. The MBTA then said that this employee was a rare exception who somehow slipped through the cracks, possibly, no one said aloud, because his father was a judge.

Challenge accepted, said the Globe, which filed public records requests on the driving records of the agency’s other engineers. It turns out that a few more others also have poor driving records. Continue reading

Uber/Lyft Find New Ways to Destroy Transit

Lyft has a growing service called Line that could make the long-unfulfilled dreams of carpool advocates come true. Users who request a ride through Line are paired with drivers going to the same general destination — a true example of ride sharing instead of the ride hailing that describes most Uber/Lyft rides. Rides might take a little longer if the driver picks up other carpoolers, but the cost is only 40 percent of a regular Lyft ride. The service is available in 19 cities to date and has proven particularly successful in New York, Los Angeles, San Francisco, Chicago, and Miami.

Uber has announced that it plans to expand its app to offer a comprehensive transportation service. Users say where they want to go and the Uber app will give them options of Uber rides, bike sharing, rental cars, or even mass transit. All rides would be paid for through the Uber app, so Uber would get a share of revenues from any public transit agencies that participated.

Even if public transit is one of Uber’s options, these kinds of innovations will continue to whittle away transit ridership. People who now ride transit will be tempted to use Uber to pay for their rides, thus saving the trouble of dealing with ticket machines or exact change. Once using the app, they will also be alerted to alternatives to transit, and some will select those alternatives in place of the transit they were using. Continue reading

Urban Highway Data

Last November, the Antiplanner noted that the Federal Highway Administration had posted many of the tables for the 2016 Highway Statistics. However, two tables that had not then been posted dealt with highways and driving by urban area. Table HM71 shows miles and daily vehicles miles driven by type of road. Table HM72 shows miles of roads, freeways, and freeway lane miles as well as other characteristics such as land area and population density for each urban area.

When I downloaded the data, the first thing I noted was that the numbers for Los Angeles are wrong. The tables say that Los Angeles, an urban area of 12.5 million people, has just 813 miles of roads, 8 of them being freeways. Alphabetizing the list revealed that most of the data (other than population and land area) for urban areas from Lee’s Summit to Los Lunas had been pushed up one urban area. So I moved them all down one urban area, and took the data for Los Lunas and put them in the row for Lee’s Summit. I’m pretty certain this is right for all of the areas except Lee’s Summit; the 2015 spreadsheet for that area was all zeros.

To do this, I had to rearrange the spreadsheets. For some reason, the Federal Highway Administration breaks up the table into nine different worksheets, with about 70 urban areas per sheet. I find this annoying because it makes it difficult to find and compare many of the smaller urban areas. Continue reading

Should Tolling Aim to Reduce Driving
or Increase Economic Opportunities?

Seattle’s mayor has announced a vague proposal to toll downtown streets in order to relieve congestion. While the Antiplanner supports congestion pricing, I oppose cordon pricing, which is more of a revenue-raising scheme than a congestion-reduction program, and it isn’t yet clear which of these two the mayor is proposing.

Tolling has a bad reputation in Seattle because stiff penalties on people who failed to pay bridge tolls were so oppressive that they put some people into bankruptcy. At the same time, a well-designed tolling system can be good for low-income people, in the same way that they are better off paying market prices for groceries rather than having food allocated by the government, which generally results in little or no food available at all.

The downtown congestion that the mayor wants to fix is a problem of the city’s own making. Thanks to a variety of subsidies and incentives, the number of jobs in greater downtown Seattle — which covers a little more than 10 percent of the city — grew by 30 percent to 262,000 between 2010 and 2017. Although only a quarter of downtown employers drive to work, that’s more than the number who drive to work in downtown Portland, where more than half the employees commute by auto but has only around 100,000 jobs. Continue reading