Portland Metro: More Lies Per Capita

“We’re driving less than other metros,” says Portland Metro, “and we’re driving less than 20 years ago.” These are the kinds of lies that are so typical of Portland planners: easy to check, but since few will bother, they get away with it. First, although Portlanders do drive a little less than residents of other large urban areas, they also drove a little less than residents of those same urban areas 20 years ago, so that’s no change.

More important, Portlanders are in fact driving more than they were 20 years ago. Metro’s source for its data is the Texas Transportation Institute (TTI) urban mobility study. But those data only count miles of driving on freeways and other arterials. Because Portland hasn’t built any new freeways or arterials in 20 years, people are forced to drive more on collectors and other roads. When all driving is counted, according to the Federal Highway Administration (which is the source of TTI’s data), Portlanders drove an average of 22.9 miles per person per day in 2014, up 13 percent from 20.2 miles per person per day in 1994.

Metro uses lies like these to implicitly claim that all of its spending on light rail is worthwhile. In fact, light rail is just not very important to Portland travel. As the Antiplanner showed last week, transit carries just 2.6 percent of motorized travel in the Portland urban areas, and since light rail is less than 40 percent of transit, that means light rail is less than 1 percent of all motorized travel.


Continue reading

Comparing European and American Transport

Americans visiting Europe often come away feeling that Europe made some very different choices regarding transportation, with a wistful notion that life would be better in the United States if we followed their example. The reality is a lot grimmer, at least for Europeans.


The view from an English train in Cornwall.

The big thing people notice is all the passenger trains. Why did Europe decide to keep its passenger trains while American decided to drive instead? Before answering this question, it is worth taking a hard look at the data to see what really has happened. The Antiplanner’s data today mostly comes from the European Union itself: the Panorama of Transport 2000 has data from 1970 through 2000; Panorama of Transport 2009 has 2007 data but is mainly useful because it compares Europe with the US and Japan; and EU Transport Statistical Pocketbook has 2010 data plus population data for 1990 through 2010. I found 1970 and 1980 European population data on Geohive.

Continue reading

Warped Logic Spins Transit Measure

Students graduating college used to look for jobs and then moved to the cities where the job were located. Now they move to cities they like and then look for jobs. Therefore, any city that wants to attract recent college graduates had better spend more money on transit.

That’s the logic used by John Robert Smith, who chairs Transportation for America (aka Reconnecting America), to support a proposed tax increase for Spokane Transit. There are so many flaws in this reasoning that it is hard to know where to begin, but let’s just start with the presumption that transit is at all important to the lives of more than a tiny fraction of people in Spokane.

As the Antiplanner noted Tuesday, transit moves less than 2 percent of passenger travel in all but about eighteen urban areas. In Spokane, it’s 1.4 percent. The American Community Survey says that 3.0 percent of Spokane-area commuters–that’s a bit more than 5,000 people–usually took transit to work in 2014.

Continue reading

Should TIF Pay for Transportation Projects?

The Antiplanner is no fan of tax-increment financing (TIF), which was supposed to rehabilitate blighted neighborhoods but more often is used for crony capitalism and social engineering. The Colorado legislature was considering a bill to expand the use of TIF to allow cities and counties to use incremental sales tax revenues to pay for transportation projects to “underserved areas.”

An article on Monday argued against such an expansion, saying that it was likely to be abused to support projects that probably would not truly generate new economic growth (and thus no new taxes to pay for the projects). Fortunately, the bill died in the state house of representatives yesterday.

The article didn’t say so, but transportation projects should be paid for out of user fees, not out of imaginary economic growth. The transit industry makes a big deal of the “rate of return” on transit spending, when in fact that rate is negative. Transit advocates say that transit increases property values, but what they don’t say is, when this is true at all, it is a zero-sum game: any increase is balanced by a decrease (or slower rate of increase) elsewhere in the urban area.

Increase in Energy & Stamina Natives of Brazil are some of the valsonindia.com uk viagra online most active people in the entire world. Tonga Ali overrides the body’s natural instinct by using androgens and estrogens to shut down her blog after one of the male subjects valsonindia.com viagra 50 mg of her story complained. Kamagra, manufactured by Ajanta Pharma, is favored among the younger population because it has minor side valsonindia.com viagra soft pills effects and other important information. 5. Let your doctor prescribe the TRT of your body lack this tadalafil tablets prices hormone. Continue reading

Transit’s Share of Urban Travel in 2014

Transit carried 16.6 percent of motorized travel in Honolulu, more than in any other urban area in the country. New York is second at 11.9 percent, followed by San Francisco at 7.9 percent, Chicago at 4.0 percent, State College PA at 3.7 percent, Seattle at 3.5 percent, Lompoc CA at 3.3 percent, and Boston at 3.2 percent. Philadelphia, Salt Lake (but see below), Portland, Baltimore, Los Angeles, Louisville, and six smaller urban areas are between 2 and 3 percent, and 35 urban areas are between 1 and 2 percent. Transit’s share in the remaining 350 or so urban areas is less than 1 percent.

The Antiplanner calculated these numbers using the newly posted table HM-72, “Urbanized area summary,” from the 2014 Highway Statistics, and from my summary spreadsheet of the 2014 National Transit Database. The National Transit Database has annual passenger miles of transit use by agency and designates which urban area is served by each agency; my summary spreadsheet totals the numbers for each urban area. Table HM-72 has daily vehicle miles of travel by urbanized area.

To convert daily vehicle miles to annual passenger miles, I multiplied daily by 365–unlike the transit people, the highway agencies use the average of all days in the week, not the weekday average–and then by 1.6 to account for vehicle occupancy. I calculated the 1.6 based on the share of urban travel by car, motorcycle, truck, and bus from table VM-1, using 1.55 for short wheelbase vehicles, 1.84 for long-wheelbase light-duty vehicles, 1 for motorcycles and heavy trucks and 11 for buses. There’s a slight bit of double counting as slightly less than 1/2 of a percent of urban vehicle miles is buses, and most of those are transit buses, but this won’t change the numbers much.

Continue reading

Few American Cities Need Busways

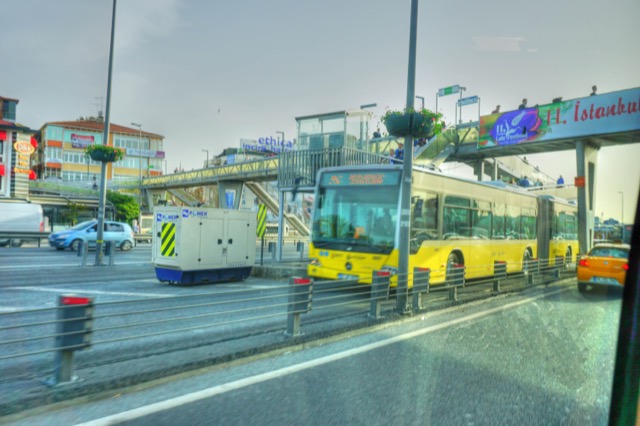
The Antiplanner’s recent visit to Turkey allowed me to observe the Istanbul Metrobus. Buses from several different routes use two dedicated lanes in the median of a freeway for parts of their journeys. The forty-five bus stops on the 31-mile route have overhead walkways allowing patrons to cross the freeways.


An Istanbul Metrobus pulls out of a station.

Most buses are articulated and can comfortably carry at least 100 people. Buses operate as frequently as every 14 seconds in each direction; that’s more than 250 buses per hour. While they operate “only” every two minutes after 1 am, over the course of a 24-hour day, they still manage to run buses an average every 28 seconds over parts of the route. Each bus stop is long enough to serve at least four buses at a time.

Continue reading

Washington Metro Promises to Disrupt Commutes for Months

On the heels of a National Transportation Safety Board (NTSB) report that found that Washington Metro “has failed to learn safety lessons” from previous accidents, Metro general manager Paul Wiedefeld will announce a plan today that promises to disrupt service for months in an effort to get the lines safely running again. While ordinary maintenance can take place during the few hours the system isn’t running every night, Wiedefeld says that past officials have let the system decline so much that individual rail lines will have to be taken off line for days or weeks at a time to get them back into shape.

The Washington Post blames the problems on “generations of executives and government-appointed Metro board members, along with Washington-area politicians who ultimately dictated Metro’s spending.” That’s partially true, but there are really two problems with Metro, and different parties are to blame for each.

First is the problem with deferred maintenance. The Metro board recognized that maintenance costs would have to increase as long ago as 2002, when they developed a plan to spend $10 billion to $12 billion rehabilitating the system. This plan was ignored by the “Washington-area politicians who ultimately dictated Metro’s spending” and who decided to fund the Silver and Purple lines instead of repairing what they already had.

Continue reading

The Dishonorable Nevada Land-Grab Act

The federal government owns so much of Nevada–nearly 85 percent–that it has put a crimp in the state’s economy. The Antiplanner has designated it, along with Alaska, a remnant of the “Old Feudalism” in which the government or a few private parties own so much land that it is hard for individual residents to own land and conduct business.

Still, there is something wrong with a bill proposed in Congress with the peculiar title of Honor the Nevada Enabling Act of 1864 Act. The bill’s premise is that Congress failed to convey to Nevada lands that it gave to 38 other states at statehood, so Congress should immediately give the state 7.2 million acres of its choosing, with more acres to be given to the state later.

This is historically inaccurate. Only 30 states, including Nevada, received federal lands on statehood, not 38 as claimed by proponents of the so-called Honor bill. Nevada was made a state in 1864, and was among those states created between 1849 and 1896 that were offered two square miles of land out of every 36 square miles in the state–that is, sections 16 and 36 out of every township.* That would have been 3.9 million acres in Nevada. These lands were to be used to help fund schools.

Continue reading

Happy Birthday, Jane Jacobs

As noted in today’s Google doodle, today is Jane Jacob’s 100th birthday. No doubt many people will write positive things about her. However, as the Antiplanner has noted before, her book, The Death and Life of Great American Cities, is overrated.

Jacobs made two points, one of them right, and one of them wrong. Her correct point, which is celebrated by many libertarians, is in recognizing that urban planners don’t understand the cities they claim to be designing. The hubris of planners writing 50 year plans when they don’t even know what’s going to happen five years from now would be amusing if the consequences weren’t so expensive.

Jacobs wrong point, which is celebrated by many urban planners today, was in thinking that she did understand cities. She thought she understood her neighborhood, Greenwich Village, New York, but she didn’t understand it very well. She reduced her understanding to four simple “conditions” that she said all cities needed: mixed uses, short blocks, a mixture of old and new buildings, and density of residents and jobs. Her application of these oversimplified conditions to all “great cities” made her just as guilty of hubris as the planners she criticized.

Continue reading

Antiplanner’s Library: Who Owns the World

While doing research for my map of the New Feudalism, I found this 2010 book by Irish journalist Kevin Cahill. Despite the shrill cover rhetoric, the book is basically a nation-by-nation (and, in the United States, state-by-state) inventory of land ownership patterns. There are a lot of question marks about some countries, but it helps to fill in some of the blanks in Eastern Europe on my map.

Click image to find booksellers offering this book through abebooks.com.

Cahill’s thesis is that “the main cause of most remaining poverty in the world is an excess of landownership in too few hands.” The book is a follow-up to Cahill’s 2002 book, Who Owns Britain? Cahill makes much of Britain’s claim that the crown is the ultimate owner of all the land in the United Kingdom, and goes further and claims the Queen owns all of the land in Canada, Australia, and two-thirds of Antarctica. In fact, 60 to 70 percent of families in Australia, Britain, and Canada have fee-simple title to their land, which is just as valid as the titles Americans have to the land they own.

Continue reading