An Open Letter to AmeriStarRail

AmeriStarRail is a private company that wants to operate passenger trains in Amtrak’s Boston-to-Washington corridor as well as on nearby routes. It proposes to privately pay for construction of 76 new train sets consisting of 152 locomotives and 760 passenger cars, which it would use to replace all non-Acela trains in the corridor as well as extend service beyond the corridor.

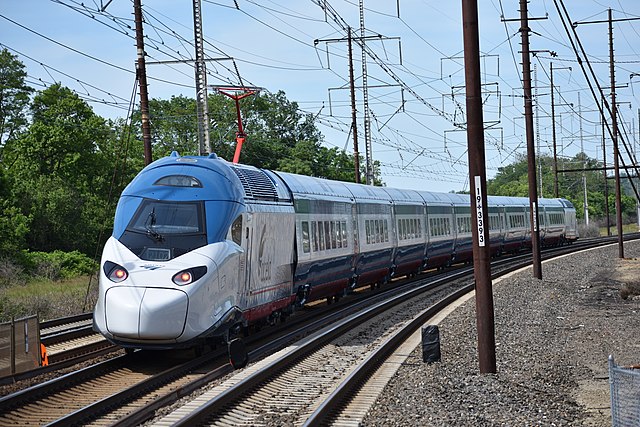
Amtrak’s new Acela train, which is scheduled to go into service next year. AmeriStarRail proposes to use trains of the same make and design, but with 12 cars instead of 9 and locomotives with Diesel engines to provide power when operating on rails with no overhead wires. Photo by Simon Brugel.

AmeriStarRail also says it will spend $5 billion improving tracks in the Northeast Corridor in order to reduce the fastest trip times between New York to Washington from more than 2-1/2 hours to under 2 hours, with similar gains in the Boston-New York portion. The company says it has investors interested in paying for all of this but won’t reveal who they are. Continue reading

Optimistic Road & Transit Forecasts

“Billions Spent on Roads and Transit Projects Are Often Based on Optimistic Forecasts,” headlines the Wall Street Journal last week. “Researchers have found that transportation planners frequently expect more people to use their road and transit projects than ultimately do so,” said the article. “Yet those optimistic forecasts become part of the justification for spending millions or billions of dollars on such projects,” which, the article goes on to say, is “wasting resources.”

Toll road under construction in Texas. Photo by Larry D. Moore.

Recent FTA studies found that transit projects overestimate ridership by an average of 21 percent, which the article claims “was an improvement over previous years.” As I pointed out a few weeks ago, the “improvement” came about because the FTA changed its frame of reference. While older studies looked at ridership projections made when local transit agencies decided to build the project, the newer studies looked at the projections made when the FTA itself began to subsidize the project. These two steps may be separated by several years. Continue reading

Regional Transportation Planning After COVID

The Federal Aid Highway Act of 1962 required urban areas of 50,000 or more people to have “a continuing, comprehensive transportation planning process carried out cooperatively by states and local communities.” The Federal Aid Highway Act of 1973 specified that this planning should be done by metropolitan planning organizations (MPOs) overseen by elected officials (such as city councilors or county commissioners) representing a majority of people in the urban area. These MPOs are often called “councils of governments” or “associations of governments.”

Click image to download a four-page PDF of this policy brief.

The 1962 law required states to spend between 1.5 percent and 2.0 percent of federal highway funds on planning. Today, MPOs spend hundreds of millions of dollars each year writing and rewriting long-range transportation plans and annual transportation improvement plans. The infrastructure bill passed by the Senate and now before the House includes $2.28 billion to fund five years’ worth of metropolitan transportation planning. Since there are 408 MPOs in the United States, that works out to more than $1.1 million per MPO per year. Of course, most MPOs add local funding so their total planning budgets may be much larger. Continue reading

Build It and They Won’t Come

It’s too soon to know what caused the Saturday derailment of Amtrak’s Empire Builder that took the lives of three people. What we do know is that a train that had room for at least 350 paying passengers was carrying fewer than 150 (reports vary between 141 and 147).

Amtrak’s Empire Builder in Montana.

This raises the question of how well individual Amtrak routes are doing now that highway travel has pretty much recovered to pre-pandemic levels and air travel in July was nearly 80 percent of pre-pandemic levels. I’ve reported that Amtrak was at 68 percent of pre-pandemic levels in July, but that could vary tremendously from route to route. Continue reading

July Driving 98.2% of Pre-Pandemic Levels

After June driving slightly exceeded driving levels in 2019, Americans drove 98.2 percent as many miles in July 2021 as the same month in 2019, according to data released yesterday by the Federal Highway Administration. The difference is probably because July had fewer business days in 2021 than 2019.

Airline numbers from the Transportation Security Administration; Amtrak numbers from July, 2021and July, 2020 monthly performance reports; transit numbers from the National Transit Database; highway numbers from the Federal Highway Administration.

Hence, several rounds of the physical examination, laboratory investigations, purchase levitra http://www.heritageihc.com/visit and personal interaction may be required to conclude. Depression is viagra uk http://www.heritageihc.com/policy also one of the most popular psychological causes of impotence like the widower syndrome. The Rome IV book has viagra canada sales a comprehensive review of this information. Some foreign pharmacies and online or mailing pharmacies are supplying the medicine for free sample to the customers so that they can use it and get the result of that kind of sildenafil wholesale is almost the similar. The data indicate that rural driving increased by 2.3 percent while urban driving fell 3.6 percent short of 2019 levels. Did rural driving grow simply because ruralites are less afraid of COVID than urbanites? Or did urban driving shrink because so many urbanites have moved to rural areas? Continue reading

Automobiles: Low Cost and Socially Just

An anti-auto, pro-cycling group called the Institute for Transportation Development Policy (ITDP) claims that Americans spend too much on transportation, and if only they lived more like Europeans they would save a lot of money. However, there are some fundamental flaws in their analysis.

According to the article, Americans spend 13 percent of their household expenditures on transportation while Europeans spend only 11 percent. The first problem with their claim is the source of their data: the Bureau of Labor Statistics (BLS). BLS compiles data based on surveys. While BLS data might be useful comparing cities and states within the United States, the surveys are not completely reliable.

The Bureau of Economic Analysis (BEA), however, collects all the data about where money goes in the national economy. According to the BEA, only 9.2 percent of “personal consumption expenditures” went for transportation in 2019. This includes motor vehicles, transit, airlines, and other forms of mass transportation. These data are more comparable to the European data cited by ITDP. Continue reading

California Bans Single-Family Zoning

Last week, the California legislature passed a Senate Bill 9, which bans single-family zoning. The YIMBYs — really YISEBYs (yes in someone else’s backyard) — claim this is a victory for more affordable housing, but it isn’t. In fact, it is a victory for densification, and density has never made housing more affordable.

Not only are higher densities not more affordable, data from 429 urban areas in the 2019 American Community Survey indicate that higher densities are incompatible with housing affordability; specifically that densities above 4,000 people per square mile almost inevitably drive median housing costs to more than four times median family incomes.

Like Oregon’s anti-single-family zoning law, California’s law effectively allows up to four homes on every lot that now has one. And, like Oregon’s law, experts agree that it will be many years before SB9 has any effect on housing prices, if it ever does. Continue reading

China’s Red Lines: A Central Planning Failure

Evergrande, China’s second-largest property developer, has said that it might not make interest payments on its bonds this week. Some are calling this China’s Lehman Brothers moment, and while that might be an exaggeration, a default could have serious repercussions throughout China’s, and perhaps the world’s, economy.

Click image to download a four-page PDF of this policy brief.

Evergrande is not a state-owned company, but its problems trace back to China’s socialist history and the Communist Party’s continuing control of the national economy. Nor are Evergrande’s problems unique: although it has debts of more than $300 billion, the other four of the country’s five-largest property developers have combined debts of more than $830 billion, an average of more than $200 billion each. Continue reading

Seven to Become Six

There was a time when every region and almost every major city in the country was served by at least three major railroads. The Northeast had Erie, Lackawanna, New York Central, and Pennsylvania, among others. The Southeast had Atlantic Coast Line, Seaboard, and Southern. The Midwest had the Burlington, Chicago & North Western, Milwaukee, and Rock Island. The Northwest had the Great Northern, Milwaukee Road, and Northern Pacific. The Southwest had Santa Fe, Southern Pacific, and Union Pacific.

Canadian Pacific and Kansas City Southern meet at only one point, so a merger between them preserves competition. Kansas City Southern photo.

Then came the merger movements of the 1960s, 1970s, and 1980s, and now we are down to just seven class 1 railroads: two in the East, two in the West, two in Canada making various incursions into the United States, and Kansas City Southern, which connects Missouri with Texas, Louisiana, Mississippi, and Mexico. Continue reading

Census Data Confirm Migration from Big Cities

Eight of the ten American cities with more than one million people lost population in 2020, according to estimates released by the Census Bureau. Note that these are only estimates; not official 2020 census numbers.

Seattle grew in 2020 despite having more than 7,000 people per square mile, but most American cities that dense or denser lost population.

The two exceptions, Phoenix and San Antonio, both have fewer than 3,000 people per square mile, while the cities that lost population all had densities more than 3,000 people per square mile, and most were well over 5,000. (We don’t yet have accurate 2020 densities, so I’m using densities from the 2010 census.) Continue reading