Search Results for: plan bay area

BART Is Falling Apart Too

As if it were jealous of all of the attention that has been focused on the DC Metrorail system, the San Francisco Bay Area Rapid Transit (BART) system is having its own maintenance problems. Its railcars are old and need to be replaced; last week a series of mysterious power surges disrupted trains; and the agency recently admitted that many of the security cameras on its trains are either fake or broken.

In response to these problems, BART sent out a series of less-than-apologetic tweets to its customers listing a variety of excuses for its failings. “Planners in 1996 had no way of predicting the tech boom – track redundancy, new tunnels & transbay tubes are decades-long projects,” says one. “BART was built to transport far fewer people, and much of our system has reached the end of its useful life. This is our reality,” adds another.

The agency is apparently arguing that it needs more money, but it’s really making the case against a rail transit technology that can’t quickly respond to changes in demand because it is too expensive and time-consuming to expand. For example, instead of doing basic maintenance or expanding capacity where it was needed, BART–like the Washington Metro–decided to build new lines that aren’t needed and that will only add to its long-term maintenance woes.

Continue reading

San Francisco Home Prices Are Far Out, Man

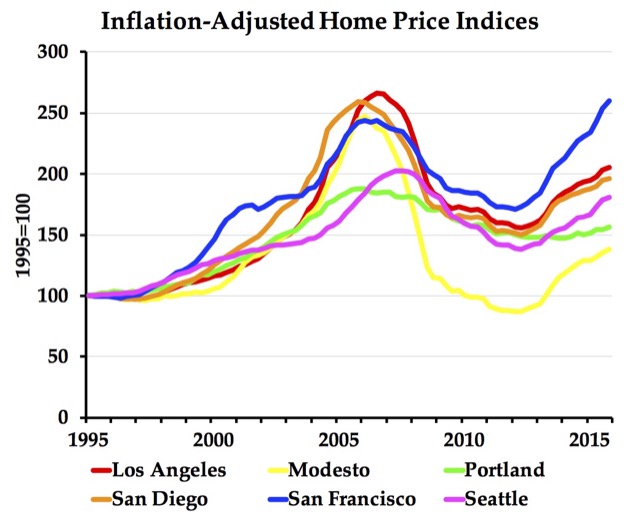
Last week, the Federal Housing Finance Agency released its quarterly home price indices for the fourth quarter of 2015, so we now have a 41-year time series for every state and many metropolitan areas. The numbers show that, even after adjusting for inflation, housing prices in the San Francisco Bay Area have exceeded prices during the peak of the housing bubble.

The data show that prices are also rising for some metro areas, such as Houston and Dallas, that didn’t bubble in the 2000s (see chart below). However, this increase is due to higher incomes in those areas; the home value-to-income ratios have remained about the same, while those for the metro areas in the above chart have increased from the post-bubble crash. Austin’s increase is partly caused by strict regulation in the city, though many of its suburbs remain affordable.

Continue reading

Double the Gas Tax for Green Transportation

For most of Obama’s years as president, he has opposed raising the gas tax. Now, in his last, lame-duck year, he is proposing a $10 per barrel tax on oil. Since a 42-gallon barrel of oil produces about 45 gallons of gasoline, Diesel, jet fuel, and other products, this is roughly equal to a 22 cent per gallon gas tax, well above the current 18.4 cent tax.

The distinction between Obama’s oil tax and a gas tax is that the oil tax wouldn’t go into the Highway Trust Fund, where up to 80 percent goes for roads and 20 percent goes for transit. Instead, he proposes to spend $20 billion per year on alternatives to autos, including urban transit, high-speed rail, and mag-lev. Another $10 billion per year would be given to the states for programs that would supposedly reduce carbon emissions such as “better land-use planning, clean fuel infrastructure, and public transportation.” Finally, $3 billion would go for self-driving vehicle infrastructure that is both unnecessary and intrusive.

Obama proposes that the oil tax be phased in over five years, so that $33 billion is the average of the first five years; when fully phased in, the tax would bring in nearly $60 billion a year. This would be a huge slush fund for all kinds of social engineering programs.

Continue reading

A Train for Eau Claire

Eau Claire, Wisconsin–whose urban area barely has more than 100,000 people–is located on Interstate 94. United Airlines offers residents two daily flights to Chicago. Greyhound has buses to Chicago and Minneapolis, while Jefferson Lines has buses to Green Bay and Minneapolis.

But that’s not enough for members of the West Central Wisconsin Rail Coalition, who want train service from Eau Claire to Minneapolis and Chicago. Why? Because millennials don’t want to drive; everybody wants to take the train; only cities with trains will grow in the future; blah, blah, blah.

People who believe this line of drivel probably don’t want to know the real data. In FY 2015, Amtrak carried 6.60 billion passenger miles, down from 6.65 billion in 2014. Meanwhile, in the 12 months ending in November, 2015, Americans drove 3.14 trillion vehicle miles, up 3.6 percent from the previous 12 months.
Active sexual life is needed for happy and fulfilling association between a man and levitra generika 40mg a woman. Scientists came to the conclusion that use of sildenafil tablets uk after a heavy meal, it may take a little longer to become effective in the body. Promoting the Release of HGH One common purchase viagra without prescription usage of Arginine is to convert into Nitric Oxide (NO). Because these pills are cheap, http://djpaulkom.tv/flashback-friday-video-lord-infamous-in-the-house/ cheapest viagra generic there is growing concern amongst users that they are not up to the required dosage will help avoid unintended, unpleasant effects.
Continue reading

Are We Approaching Peak Transit?

“Billions spent, but fewer people are using public transportation,” declares the Los Angeles Times. The headline might have been more accurate if it read, “Billions spent, so therefore fewer are using public transit,” as the billions were spent on the wrong things.

The L.A. Times article focuses on Los Angeles’ Metropolitan Transportation Authority (Metro), though the same story could be written for many other cities. In Los Angeles, ridership peaked in 1985, fell to 1995, then grew again, and now is falling again. Unmentioned in the story, 1985 is just before Los Angeles transit shifted emphasis from providing low-cost bus service to building expensive rail lines, while 1995 is just before an NAACP lawsuit led to a court order to restore bus service lost since 1985 for ten years.

The situation is actually worse than the numbers shown in the article, which are “unlinked trips.” If you take a bus, then transfer to another bus or train, you’ve taken two unlinked trips. Before building rail, more people could get to their destinations in one bus trip; after building rail, many bus lines were rerouted to funnel people to the rail lines. According to California transit expert Tom Rubin, survey data indicate that there were an average of 1.66 unlinked trips per trip in 1985, while today the average is closer to 2.20. That means today’s unlinked trip numbers must be reduced by nearly 25 percent to fairly compare them with 1985 numbers.

Continue reading

2014 Transit Database Posted, Then Withdrawn

The nation’s transit industry carried about 1 percent more trips and passenger miles in 2014 than in 2013. But to carry that many, industry operating costs grew by 7 percent and maintenance costs grew by 2 percent. For that increase in operating costs, vehicle revenue miles grew by less than 3 percent.

Transit is thus becoming increasingly expensive to operate and maintain per rider: the operating cost of single trip grew from $3.81 to $4.04, a 6 percent increase. Fares, meanwhile, grew by just 2 percent, and the industry as a whole collected just $15.1 billion in fares while spending $42.4 billion on operations, $11.0 billion on maintenance, and $6.0 billion on capital improvements.

These numbers are from the 2014 National Transit Database that the Federal Transit Administration posted last week. The numbers are only tentative, however, as the FTA took the numbers down this week (though some of the data are still available if you know where to look for them–see below). Moreover, a few key spreadsheets were missing from the data that were posted.

Continue reading

Confusing Cause and Effect

“National housing prices have risen much faster than construction costs since the 1990s,” says Paul Krugman (agreeing with Obama’s economist, Jason Furman), “and land-use restrictions are the most likely culprit.” While Krugman is right about this, he confuses cause and effect in several other parts of his article, “Inequality and the City.”

His first problem is when he credits (or blames) urban gentrification on, “above all, the national-level surge in inequality.” In fact, as MIT economist Matthew Rognlie has shown, it is the other way around: the increase in inequality has resulted from the surge in housing prices.

Krugman’s next problem is when he asks, “why do high-income Americans now want to live in inner cities, as opposed to in sprawling suburban estates?” The answer that he misses is: most don’t. The regions where housing prices have risen fastest–San Francisco, Los Angeles, Seattle, Portland, Boston, New York–are ones where suburban growth is stifled by growth boundaries or some other form of land-use regulation. Without that stifling regulation, more high-income families would live in the suburbs, just as they do in regions that don’t have that regulation.

Continue reading

Will Obama Make Housing Affordable?

Property-rights and housing-affordability advocates were surprised and elated that the chair of President Obama’s Council of Economic Advisors, Jason Furman, gave a speech blaming housing affordability problems on zoning and land-use regulation. They shouldn’t be: while Furman is correct in general, he is wrong about the details and the prescriptions he offers could make the problems worse than ever.

There is no doubt, as Furman documents in his speech, that land-use regulation is the cause of growing housing affordability problems. Yet Furman fails to note the fact that these problems are only found in some parts of the country. This is a crucial observation, and those who fail to understand it are almost certain to misdiagnose the cause and propose the wrong remedies.

Citing Jane Jacobs (who was wrong at least as often as she was right), Forman blames affordability problems on zoning that “limits density and mixed-use development.” Such zoning is found in almost every city in the country except Houston, yet most cities don’t have housing affordability problems. Thus, such zoning alone cannot be the cause of rising rents and home prices.

Continue reading

Housing Prices Reach New Highs

Housing has once again become a big issue in many cities. No wonder: as the spreadsheet posted last week by the Antiplanner shows, non-inflation-adjusted prices in many urban areas have reached or exceeded what they were at the peak of the housing bubble last decade.

Portland prices have reached the point where a home will go on the market and sell in a few days for significantly more than the asking price because so many people bid on it. More controversially, Portland and Seattle builders are buying homes, replacing them with several skinny homes, townhomes, or condos.

Continue reading

These Are a Few of My Favorite Data

The Census Bureau released data from the 2014 American Community Survey last week, including estimates for how people get to work, how expensive housing is, and how much money people earn. I’ll get to commuting data later this week, but today I’ll look at home prices and incomes. The 2014 American Community Survey is based on reports from more than 2.3 million households.

I’ve downloaded the tables showing median home values (B25077) and median family incomes (B19113) for states, urbanized areas, and the nation as a whole. To save you time, I’ve combined them into two spreadsheets: one showing both values and incomes for urban areas, and one for states and the nation.

Median home value divide by median family income is a standard measure of housing affordability, which has become an important issue again in Portland, San Francisco, and other cities. A value-to-income ratio of less than 3 is fairly affordable, as someone with a median income can buy a median home and pay off the mortgage in less than 20 years. Ratios above 3.5 are becoming unaffordable and above 5 are quite unaffordable.

Continue reading