Search Results for: plan bay area

Making California Housing Affordable

A bill being considered by the California legislature aims to make the state’s housing more affordable. According to this analysis, the bill amends the state’s Planning and Zoning Act by requiring cities and counties to take more steps to keep housing affordable.

The bill is supported by various home building associations as well as some non-profit groups such as the California Council of Churches, St. Vincent DePaul, and the California State Firefighters Association, which worries that firefighters and other public employees can’t afford to live in the cities they serve.

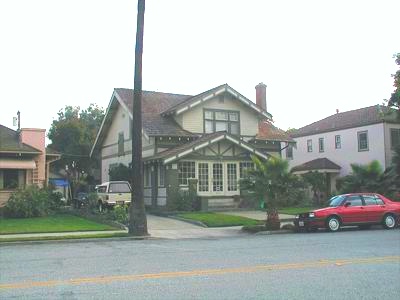
Is California’s housing system broken? This house would cost $150,000 in Houston, $400,000 in Bakersfield, $950,000 in Marin County, and well over $1.2 million in San Jose.

Continue reading

Let’s Reduce Congestion by Tearing Out Freeways

Those wacky planners are always coming up with crazy ideas. Recently, a planner over at Planetizen proposed that cities should remove urban freeways.

His reasoning was simple. Freeways are ugly. Cars are evil. Freeways induce more driving. So if we get rid of the freeways, people will drive less and everyone will be happier.

Beauty vs. mobility?
Flickr photo by gsgeorge

I can’t argue with the notion that some freeways are ugly, but so are a lot of things and beauty, after all, is in the eye of the beholder. Everything else about this argument is simply wrong.

Continue reading

The Nation’s Worst-Managed Transit Agency Hires a New CFO

After building more light-rail lines than it can afford to operate, the Santa Clara Valley Transportation Authority (VTA) has made so many service cuts that it has lost a third of its riders. VTA’s chief financial officer resigned after an outside audit (previously discussed here) criticized the agency for building expensive rail projects to politically powerful (but auto-liberated) neighborhoods without ensuring that the agency had the funds to operate the system.

Last June, angry voters turned down a sales-tax increase designed to help the agency get back on its feet and build more rail lines. Now, under pressure to prove they can be fiscally responsible, the board of directors has hired a new “temporary” CFO, paying him $13,600 for 39 weeks of work.

Excuse me, what was that? Not $13,600, you say, but $13,600 per week? For 39 weeks? That’s $530,400. The previous CFO only got $200,000 a year, meaning his weekly wages were less than a third of the new guy’s. No wonder he did such a lousy job — they weren’t paying him enough!

Continue reading

The Nation’s Worst Transit Agency

I’ve previously noted that the Santa Clara Valley Transportation Authority (VTA) may be the nation’s worst-managed transit agency, at least among those serving big cities. Now a new report commissioned by VTA’s own board of directors confirms many of my concerns.

The new report was written by a company called Hay Group. Most consultants fawn all over their clients, but this report is surprisingly frank. Among other things, it accuses VTA of building “capital projects” (i.e., light rail) that benefitted politically powerful neighborhoods without insuring that it had the money to operate those projects. The result is low ridership and high operating costs.

When there is just one car, it is not a train. Flickr photo by LazyTom.

Continue reading

More Than 10 Billion Served

Congratulations to the American transit industry for managing to carry more than 10 billion transit trips in 2006, the first year it has done so since 1957.* Naturally, the American Public Transportation Association (APTA) considers this to be proof that we need to funnel even more subsidies into transit.

“This significant ridership milestone is part of a multi-year trend as more and more Americans ride public transit,” says APTA’s president. “This milestone represents 10 billion reasons to increase local and federal investment in public transportation.”

Rapid growth? Click the chart to download a spreadsheet with the actual numbers, which are from APTA Transit Factbooks.

Continue reading

Junk Science Week: #2 – Density & Congestion

I’ve previously discussed the myth that density relieves congestion, yet it persists. Most recently, planners in Fairfax County, Virginia say they want to put thousands of high-rise apartments in Tysons Corner in an effort to increase the density and relieve congestion around proposed rail stations.

Planners claim that Ballston, a rail station on the DC Orange line, proves that this strategy is successful. The opening of the Ballston station in 1979 led to a lot of transit-oriented development, and today many people in the area walk or take transit to work.

However, planners fail to mention that a major freeway, I-66, opened at about the same time, and it probably did more to stimulate development than the rail line. At least, other stations that were not close to new freeway interchanges failed to develop as planners hoped.

Continue reading

Where Is Your Adaptive Management Now?

A supplemental environmental impact report (SEIR) has just been issued for the extension of BART to San Jose. Planners say the 16.1-mile extension will cost a whopping $4.7 billion, yet they project that it will increase local transit ridership by only 2 percent.

By coincidence, $4.7 billion just happens to be the cost of Denver’s FasTracks plan, which is supposed to build about 119 new miles of rail lines plus busways for 18 miles of bus-rapid transit. San Jose taxpayers are obviously not getting much for their money.

Continue reading

Density Increases Congestion

In an earlier post, I mentioned that density increases congestion and was chastised for failing to prove it. So here is the evidence.

Start with data from the 2000 census that compares the percentage of commuters who drive to work with the population density of nearly 400 urbanized areas (areas with more than 50,000 people). If density reduced congestion, then increased densities would greatly reduce auto commuting.

Continue reading

Region-by-Region Review of Rail Transit

About twenty-five urban areas had rail transit in 2005. Transit systems in five of these lost market share to the automobile, they gained in eight, and in eleven they held their own (when measured to the nearest tenth of a percent). Data for the twenty-fifth, New Orleans, are not available.

“Holding their own” may sound good for transit systems in our auto-oriented society. But it is a disappointment when so much more has been promised for the expensive rail lines being built in so many cities. This is especially true when all but seven of these transit systems — rail and bus — carry under 2 percent of total passenger travel in the regions they serve.

Continue reading

More on Modeling: Cities Are Queerer Than We Can Imagine

Some planners and economists once built a model of their city. They assumed all the jobs were downtown and people wanted to minimize the combined cost of housing and commuting. How far, on average, would people live from work?

The model said, “One mile.” But census data showed that people actually lived an average of seven miles from work.

The planners and economists had totally opposite responses to this answer. The economists assumed there was something wrong with the model, and set about refining it. Instead of a monocentric model in which all jobs were downtown, they created a polycentric model that spread jobs across several different job centers. The revised model said people would live a little more than two miles from work.

“Naturally we don’t expect the real world to fit the model perfectly,” wrote the economists, “but being off by a factor of seven or even three is hard to swallow.” The economists concluded that the model needed much more refining.

Continue reading