Search Results for: rail projects

The Value of VMT

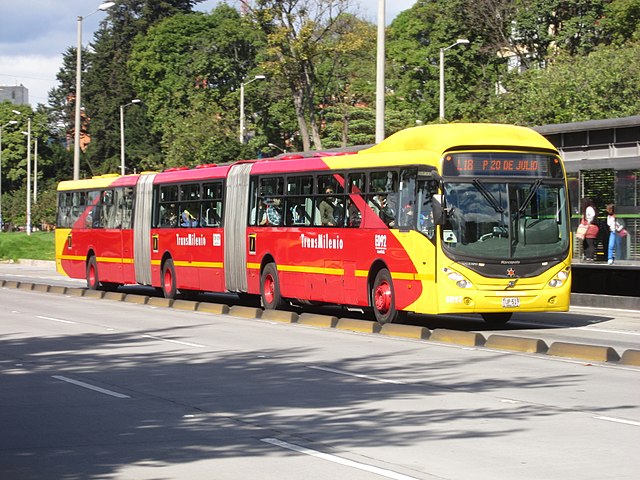
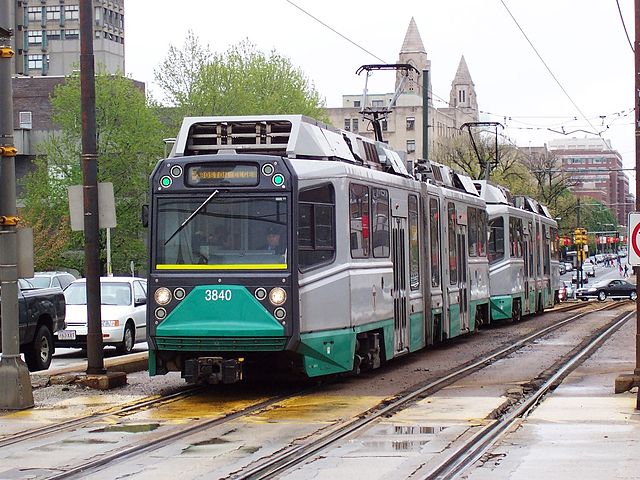
Before the pandemic, there was a mindset among urban planners that driving was bad and the ultimate goal of all of their policies was to reduce vehicle-miles traveled (VMT). That’s why they wanted to build obsolete urban transit systems like light rail and streetcars instead of freeways. That’s why they wanted more people to live in high-density housing projects instead of low-density suburbs. That’s why they wanted to reduce the amount of parking available to residents, shoppers, and others.

Photograph by B137.

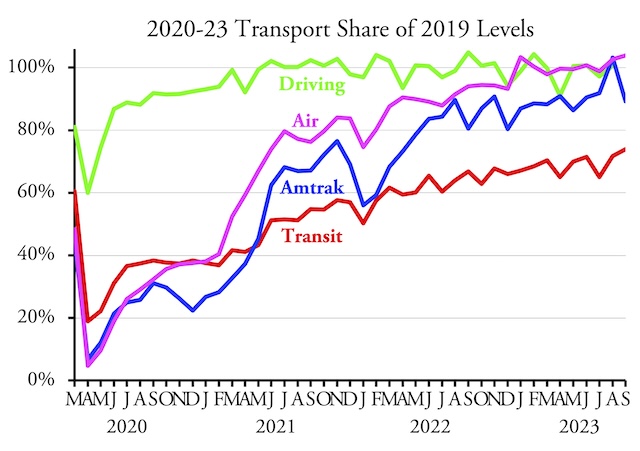
So far, the pandemic has not awakened them to the folly of this mindset. Driving has fully recovered and in much of the country people are driving more miles than ever, while transit is little more than half what it was. Instead of acknowledging these changes, cities and regions are writing plans that never mention the pandemic and relying on pre-pandemic data to justify their policies. Continue reading

2022 Transit 62.0% of 2019

Urban transit carried just over half a billion trips in the United States in December, and just under 6 billion in 2022 as a whole, according to December 2022 transit data released Monday by the Federal Transit Administration. December’s ridership was 66.0 percent of December 2019 while the calendar year’s was 62.0 percent.

Transit trips are from the National Transit Database; Amtrak passenger-miles are from Monthly Performance Reports; airline passenger data are from the Transportation Security Administration; and highway vehicle-mile data are from the Traffic Volume Trends. December highway data will be available in a week or so.

Meanwhile, after reaching above 90 percent of 2019 numbers in November for the first time since the pandemic, Amtrak numbers fell to 80 percent in December, its lowest, measured as a percentage of 2019, since May. Airline passenger numbers fell a little bit as well, but only from 94.3 to 93.3 percent of 2019. December highway numbers should be available soon. Continue reading

2021 Transit Data

Transit agencies carried 45 percent as many riders in 2021 as in 2019. To do so, they operated vehicles 81 percent as many miles as in 2019. However, they managed to spend 98.5 percent as much money on operating costs, according to data released yesterday by the Federal Transit Administration.

Nearly empty transit buses and trains don’t save energy or reduce greenhouse gas emissions. Photo by Jim Fischer.

The annual National Transit Database reports are based on the fiscal years of the transit agencies, which can end anywhere from March 31 to December 31. This means the 2021 data are the first full year since the pandemic began. By mid-2022, transit ridership had recovered to about 60 percent of pre-pandemic numbers, but it is likely that transit agencies are still spending as if they were getting 100 percent of riders. Continue reading

MBTA Crashes and Burns

The Massachusetts Bay Transportation Authority (MBTA) is crashing and burning, sometimes literally. An Orange line train caught fire a few weeks ago. A Red Line train ran away out of control. The Orange line and parts of the Green line are in such bad shape that they have been shut down at least until September.

The Orange line in 1978, when it was in a lot better condition than it is today. Photo by Henry Petermann.

The situation is so bad that various think tanks have proposed putting the agency in receivership, which would mean taking control from its highly politicized board of directors. At least one member of Congress from Massachusetts agrees, saying that the federal government should take control. But it’s not clear that federal oversight of DC’s Metro system did much to solve that system’s safety problems a few years ago. Continue reading

The Importance of Fare Enforcement

According to the New York City police department, subway crime is up 53 percent so far in 2022 compared with 2021. Since ridership grew by 64 percent in that time period, that means that crime rates per rider have actually fallen, but that doesn’t reassure many people.

This photo was taken by MassDOT in 2010, when the MBTA could say that 2009 crime had reached a 30-year low. Yet FTA data show that, by 2021, the MBTA suffered almost 19 times as many “security events” as in 2009: 94 vs. 5.

Nationwide, Federal Transit Administration data show that, through the end of March 2022, transit crime (not counting suicide) is 44.4 percent more than the same period in 2021. This is almost exactly the same as the increase in ridership, which was 44.9 percent. Former riders who are reluctant to return to transit may be justified in not doing so. Continue reading

May Transit 59.5% of Pre-Pandemic Levels

Transit ridership remained below 60 percent of pre-padenmic levels in May 2022, according to data released by the Federal Transit Administration yesterday. This was only a slight improvement over April’s 58.7 percent despite average fuel prices climbing from a little over $4 in April to more than $4.50 in May.

Amtrak passenger miles, meanwhile, reached 78.5 percent of May 2019, a 5 percent climb from April. Air travel remained right around 90 percent of pre-pandemic levels. Driving data will be released later this month. Continue reading

Seattle’s Sound Transit Is Officially Insane

Mariya Frost, of the Washington Policy Center, has alerted me that Seattle should be added to the list of cities with transit projects gone wild. Sound Transit, the region’s rail transit authority, has raised the projected costs of projects built between 2017 and 2046 from $54 billion to $142 billion.

An artist’s impression of a planned Seattle light-rail line. Notice that the artist didn’t project any decline in automobiles or driving. Photo from Siemens.

Most of the increase is for the cost of building 62 miles of light-rail lines. Seattle already had the most-expensive light-rail system in the nation, but the latest costs are completely insane. Continue reading

Transit Construction Costs Run Wild

America’s transit industry has been heavily criticized for spending so much on construction. Yet the industry continues to roll up cost overrun after cost overrun for projects that should have been too expensive to build in the first place.

VTA’s planned single-bore tunnel into downtown San Jose. Figure by VTA.

Take, for example, the BART line to San Jose, which is being planned and built by the Santa Clara Valley Transportation Authority (VTA), which has never displayed much competence in the past. Rather than cut and cover two small tunnels into downtown San Jose, which is the usual practice, VTA wants to bore one gigantic tunnel three to four stories underground. The 6-mile line was originally projected to cost $4.1 billion, but last October the Federal Transit Administration (FTA) announced that it expected the cost to be $9.1 billion, or $1.5 billion a mile, and the agency expressed doubts that VTA had the funds to cover this cost overrun. Continue reading

Transit’s Zombie Future

March transit ridership pushed up above 60 percent of pre-pandemic numbers for the first time since the pandemic began, according to data released by the Federal Transit Administration last week. Ridership was boosted by the fact that March 2022 had two more weekdays than March 2019. Since April 2022 has one fewer weekday than April 2019, ridership is likely to dip back down below 60 percent in April.

Click image to download a four-page PDF of this policy brief.

Transit is still lagging well behind other modes of travel. Amtrak carried 68 percent as many passenger-miles as in March 2019 while the airlines carried 88 percent. Domestic air travel was probably above 90 percent, but data sorting domestic from international travel won’t be available for a couple of months. Miles of driving in March will be available in about a week but are likely to be more than 100 percent of March 2019 miles.

Continue reading

LA Metro Celebrates Losing 138 Million Bus Riders

Los Angeles Metro recently celebrated the tenth anniversary of the opening of its Expo light-rail line. Construction on the line began in 2006, a year in which LA Metro buses carried 409 million trips, and the line opened in April, 2012.

The LA Expo line shortly after it opened. Photo by Gary Leonard for Los Angeles Metro.

To help pay for the Expo and other new light-rail lines, LA Metro cut bus service by nearly a quarter between 2006 and 2019. This contributed to the loss of a third of its bus riders, or nearly 138 million trips per year. The Expo line, meanwhile, boosted light-rail ridership by about 2 million annual trips, enough to make up 1.5 percent of the loss in bus ridership. Continue reading