
In what I regard as a victory for common sense, the Ottawa city council has killed a planned light-rail line. Unfortunately, this may be a costly decision as a previous city council had signed a contract to construct the line, and the contractors say they want compensation for the cancellation.
The 18-mile line, which had been approved by the city council last July, was expected to cost CN$778 million, or about CN$43 million per mile. The Province of Ontario had promised to cover about CN$400 million of this cost, leaving the city to find CN$378 million.
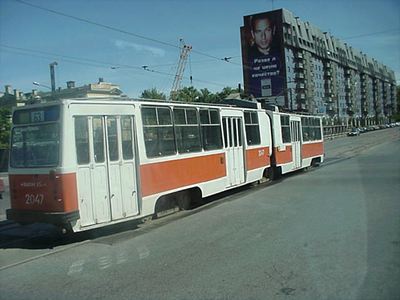
Light rail passing high-density housing in Moscow. Photo by Lowell Grattan.
But after having spent CN$65 million on the project, a new city council elected in November decided light rail was a waste of money. In December, they voted 13-11 to cancel just before a contract deadline.


