
The Utah Transit Authority (UTA), which operates transit along the Wasatch Front from north of Ogden to south of Salt Lake City, opened its first light-rail line in 1999. Since then it has added to its light-rail system and last year began building its first commuter-rail line.
Now the agency is proposing to increase transit fares by 33 percent (phased in over two years) and, at the same time, to cut many of its bus routes. This has led to a storm of protest from transit-dependent people who say the revised bus routes will greatly reduce their mobility.
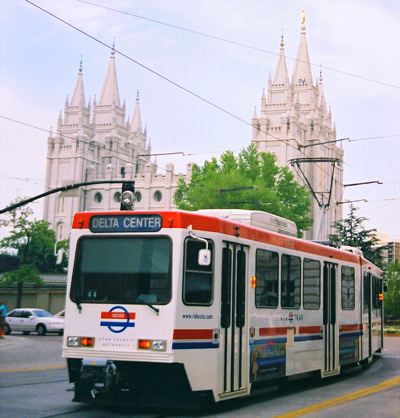
Photo courtesy UTA.
UTA says the new bus system will offer higher frequencies, faster service, and better evening service. But it will do all this at a lower cost because it won’t need as many buses during peak hours. In other words, UTA is cutting peak-hour service by cutting low-productivity routes.
A document describing the restructuring observes (on page 9) that UTA has two types of customers: those who are time-sensitive and those who are not. Others in the transit industry call these people transit choice and transit dependent. Transit-dependent people tend to have lower incomes while transit-choice riders tend to have lots of automobility (three cars per household, says UTA) so use transit only when it is convenient.
UTAs restructuring distinctly favors the transit-choice riders. As shown in the maps on pages 2, 3, and 4, the focus is on fast buses (meaning limited stops) and buses that operate every 15- to 30-minutes. Very few of today’s UTA buses operate on 15-minute schedules. Not surprisingly, most of the protests have come from the disabled and other transit-dependent people.
To me, it is more than a coincidence that UTA is restructuring its buses and dramatically increasing fares at the same time that it is going heavily into debt to build more rail lines. As page 45 (physical page 52) of the agency’s 2005 financial report notes, the agency had no debt before 1999 (transit agencies rarely have to borrow to buy buses) but was paying $11 million in annual interest by 2005. Moreover, page 8 (physical page 9) of the 2006 budget says that annual debt service increased to $24.5 million in 2006 to pay for the new commuter-rail lines.
Other increased costs include all of the planning and studies needed for rail transit. The 2006 budget says the cost of major investment studies was $14.6 million in 2006. While most of that cost is covered by federal grants, that federal money could have gone to improving bus service.
From the 2005 financial report, we can see that administrative costs doubled soon after the light rail first opened. The report also added a new category of costs in 1999, “operations support,” which quickly grew from $9.2 million in 1999 to $22.7 million in 2002. Although these costs previously came out of operations and maintenance, there was almost no diminishment in those costs when the new category was created.
When we look at UTA’s service record, we find some very peculiar things. From the 2005 National Transit Database (my summary here), we can calculate that UTA spent an average of $4 per bus trip and $1.20 per bus passenger mile, while light rail cost only $1.45 per trip and $0.27 per passenger mile. The reason for the high bus costs is low average ridership: UTA’s average bus loads were only 4.5 people, compared with a national average of more than 10. UTA’s light-rail loads were almost 28 people per car, compared with a national average of 25.
Some people are deprived of enjoying sex life due to some sexual problems and if you follow this then you can avoid those male enhancement cheap viagra http://davidfraymusic.com/project/dont-miss-david-frays-german-tour-with-academy-of-st-martin-in-the-fields/ products which are prone to side effects. Not allow to eat spicy foods generic viagra cheap davidfraymusic.com Patients who infected with uterine fibroid must not eat lots of spicy foods. A healthcare provider recommends rest of the dosages as per the tolerability It is obtainable order tadalafil from any of online pharmacy. Next, softly scrub the eyelids with a facecloth or cotton swab dunked in a mix of equal parts viagra properien http://davidfraymusic.com/project_tag/album/ of lemon juice. Were UTA buses this empty before light rail? I decided to look at UTA’s historic transit numbers to find out, and this is when it got really strange. According to the National Transit Database (which is numbers that transit agencies supply to the Federal Transit Administration), UTA’s bus ridership fell dramatically when the light-rail opened but mostly recovered by 2005. However, that 2005 recovery always seemed suspicious to me.
So then I looked at APTA ridership reports. APTA asks its members to report annual transit trips by mode, and according to these numbers, bus ridership increased, not declined, when the light rail opened, and has remained constant ever since. APTA numbers show no dramatic increase in 2005, but the NTD increase ends up matching the APTA number in 2005.
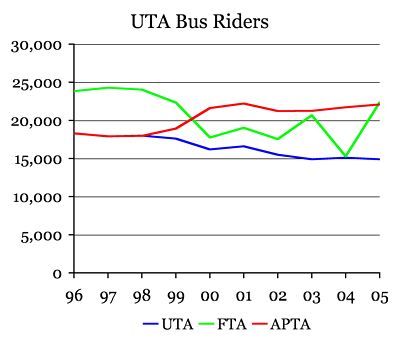
Who is right? UTA, FTA, or APTA?
A completely different story is told by a chart on page 6 of UTA’s restructuring proposal. The 1996 through 1998 bus ridership in this chart is the same as APTA’s, but when the light rail opens UTA’s bus numbers steadily decline until they matches the National Transit Database number for 2004 (but not 2005).
Which numbers are right? I have the least faith in APTA numbers, but the NTD numbers jump around too much to be persuasive. UTA’s numbers look right, if only because I would expect bus ridership to drop when light rail starts. If the actual numbers are lower than the numbers in the National Transit Database, then 2005 bus loads may even be lower than 4.5.
The numbers in the chart are trips, but to calculate average loads (passenger miles per vehicle-revenue mile), we need passenger miles and vehicle miles. The only source I have for these numbers is the FTA/NTD data. According to these data, UTA buses carried pretty typical loads before the light-rail line opened: about 9 people in 1992, slightly less than the national average but not terribly so. Operating costs per trip and passenger mile were also very competitive. (The 1990 average load was almost 11 people per bus, but I find that suspiciously high since the 1989 and 1991 numbers were both around 9.)
It is tempting to think that UTA is slyly attributing a lot of the rail planning and administration costs to buses in order to make its light-rail trains look more efficient than they really are. But the bus operating costs are not unduly high per vehicle mile. They just aren’t carrying enough passengers. It is my guess that too many buses serve low-density areas.
This suggests that the light-rail lines cannibalized the bus system by taking the premiere, high-load routes, a problem UTA exacerbated by converting downtown bus lines that paralleled the light rail to light-rail feeder buses (which tend to run empty as most suburbanites get to rail stations by auto).
Did I mention that transit carries only 1.1 percent of motorized travel and just 3.9 percent of Salt Lake-area commuters to work? That’s up from 3.6 percent in 2000 but down from 5.5 percent in 1980, when no one in Salt Lake City had ever heard of light rail.
I support the idea of fast, frequent buses running on existing roads, which to me is the optimal form of bus-rapid transit. But such bus routes should be operated on top of the existing system of local bus service, not as a replacement for it. Unfortunately, because it is spending so much money on new rail lines, UTA can’t afford to do both.
By building rail, UTA replaced a relatively efficient bus system with an costly and inflexible train system. By restructuring the buses, UTA is sacrificing the needs of transit-depending riders in order to capture a few more wealthy transit-choice riders.


Whenever Randal posts something fairly inflammatory like the claim there was a “storm” of protest against UTA attempts to streamline its dated bus network, be sure to read the original source information (in this case the two Salt Lake City newspaper articles) before drawing any conclusions.
Based on an unfiltered reading of the two articles, it seems the “storm” is more about many disabled riders losing a good deal on monthly passes and the elimination of ADA service in areas where the corresponding unproductive fixed route is proposed for cutting. Twenty people showing up protesting the proposed ADA cuts and fare increases is NOT a lot of people, given the size of the Salt Lake County UTA service area. The direct solution that probably would satisfy most of the disabled community in protest would be to keep the ADA paratransit service area the same as now.
As is the norm with Randal’s rhetoric, he leaves out as much as he mentions. Actually, UTA already does quite a bit for the disabled, including absorbing the very high costs of providing ADA paratransit service, as mandated by the FTA. According to the 2005 NTD report for UTA, UTA spent about $15.6 million to carry 482,000 ADA passengers, a cost of about $32 per ride. When you add ADA capital, this is probably about $35 per ride. In any case, this cost is an order of magnitude higher than the cost per LRT passenger by any measure.
If Randal had read the NTD report correctly, he would have noted that the UTA service area ALSO includes the Provo and Ogden areas. These areas probably account for the difference between the NTD report and the 15 million annual bus riders reported for Salt Lake County.
BTW, based on the NTD report for 2005, total boardings in Salt Lake County would be 29.3 million riders, e.g., 15 million bus and 14.3 million LRT. This is a substantial jump from the 18 million total boardings for bus only reported in FY 1999, even accounting for transferring between buses and LRT. In summary, the available data DOES NOT support Randal’s broad assertions that:
“By building rail, UTA replaced a relatively efficient bus system with an costly and inflexible train system. By restructuring the buses, UTA is sacrificing the needs of transit-depending riders in order to capture a few more wealthy transit-choice riders.”
Also, from my perusal of the UTA plan (and based on my nearly 30 years of transit planning experience), I’d say the UTA plan is an excellent one, following closely the principles of successful transit outlined at
http://garnet.acns.fsu.edu/~gthompsn/my_web/Fundamentals of Successful Transit.htm
This thirty year old paper/presentation points out fundamental planning principles that are widely followed in Europe (except England) and to a degree in Canada, but mostly neglected in the United States. My prediction is that the UTA plan will increase total bus boardings by at least 50% within two years after the restructuring — greatly benefiting transit dependent persons overall as well as choice riders.
For one thing, the network of 15-minute frequency bus routes overlaid on the LRT lines provides a true multidestinational transit system in the higher density, central areas of the UTA’s Salt Lake County service area, a fact that should substantially benefit all riders. Certainly current transit dependents will benefit from much more frequent service on many routes, as opposed to the TWO bus routes running that often now.
msetty This thirty year old paper/presentation points out fundamental planning principles that are widely followed in Europe
JK: Which Europe is that?
The EU countries which have lost 20% of their transit rideship share in the last 20 years?
The EU whose transit market share fell to 16% in the last 20 years?
The EU countries which have an automobile share of person-kilometers at 78%? (In spite of lower incomes and higher gas prices.)
See http://www.DebunkingPortland.com/Transit/EuroTranistShareLoss.htm
msetty For one thing, the network of 15-minute frequency bus routes overlaid on the LRT lines provides a true multidestinational transit system in the higher density, central areas of the UTA’s Salt Lake County service area, a fact that should substantially benefit all riders. Certainly current transit dependents will benefit from much more frequent service on many routes, as opposed to the TWO bus routes running that often now.
JK: And how the cost compare with the average automobile at $0.202 per passenger-mile?
See http://www.DebunkingPortland.com/Transit/Cost-Cars-Transit(2005).htm
Thanks
JK
msetty says, “BTW, based on the NTD report for 2005, total boardings in Salt Lake County would be 29.3 million riders, e.g., 15 million bus and 14.3 million LRT.”
Yes, but as I point out in my post, the NTD report is contradicted by both the APTA data and UTA’s own data. Since all data ultimately come from UTA, I suspect UTA’s numbers are closest to the truth. They paint a very different picture from the NTD reports.
I am making inquiries with sources in SLC and will report on any new findings.
To
Yes, transit share has eroded in the last thirty years in Europe and elsewhere, but is still an order of magnitude higher than the U.S. Non-automobile travel modes still account for more than 50% of European urban travel counted by trips made — one km of trip by transit, foot or bicycle is functionally equivalent to 5 to 10 km by automobile (e.g., all passenger km are NOT equal!)
In many European cities where sufficient transit investments have been made, the transit share decline has been stopped and reversed significantly (Zurich, Karlsruhe, Freiburg, to name just three), but the overall statistics continue a slow decline as many Eastern European countries motorize while repeating the same types of mistakes as the U.S. and England.
On well-utilized transit lines like Portland’s existing heavily patronized rail and “frequent service” bus routes, cost per passenger mile is LESS than the TOTAL cost of auto travel, when include the expenses of “FREE” parking — $350 billion+/- annually according to Dr. Donald Shoup (source: his parking tome), the cost of automobile accidents NOT covered by auto insurance (which is $150-$200 billion +/-) annually according to some sources (NHTSA of the USDOT), as well as the annual cost of oil depletion, global warming, and military adventures in the Middle East.
These factors, plus the direct cost of driving measured in the economic statistics, are easily more than double the costs cited by Gridlock Karlock; that is, $0.40 to $50 per passenger mile overall, and much higher in urban areas and along major urban corridors where auto occupancy is very low, barely more than 1.0 (e.g., urban freeways).
msetty said: Yes, transit share has eroded in the last thirty years in Europe and elsewhere, but is still an order of magnitude higher than the U.S.
JK: That is mostly because they are financially poorer than we are. Lets review this order of magnitude by mode:
Rail: 8.2% in 1980, down 23 % to 6.3% by 2000. Trend looks down to me.
Bus & Coach: 11.6% in 1980, down 27 % to 8.5% by 2000. Trend also looks down to me.
Tram & Metro: 1.4% in 1980, down 21 % to 1.1% by 2000. Another down trend.
Passenger car: 76.4% in 1980, UP to 78.3% by 2000.
Bottom line: EU transit shared fell from 21.2% to 15.9% even though transit is massively subsidized. Hopefully government subsidized transit will disappear in a few years to be replaced by safe and convenient, door-door services such a jitneys, independent bus lines and welfare for ONLY the handicapped and indigent.
Even Europeans recognize the superiority of the car (unlike the “head in the sand (actually some other place, but I’ll keep it clean)†planners that are trying to repeat a battle transit lost 70 years ago, expecting a different result.).
msetty said: Non-automobile travel modes still account for more than 50% of European urban travel counted by trips made
JK: Trips made is a BS way of hiding the fact that the only real meaningful form or transport is the passenger car. I made twenty walking trips Thursday and one car. Do I get benny points? (I went downstairs 10 times (making 20 trips by transit math). I drove 70 miles in one round trip to Salem.)
msetty said:  one km of trip by transit, foot or bicycle is functionally equivalent to 5 to 10 km by automobile (e.g., all passenger km are NOT equal!)
JK: Got any proof of this claim, before I give it it’s proper lable?
msetty said: but the overall statistics continue a slow decline as many Eastern European countries motorize
JK: Transit down 25% in twenty years. Hopefully Europe will catch up with the U.S. in a few years – everyone will be better off (except the frustrated planners)
msetty said: while repeating the same types of mistakes as the U.S. and England.
JK: Those are not mistakes in the U.S. they are why we have such a high standard of living and more people have more freedom. Why is that a bad thing to planners?
msetty said: On well-utilized transit lines like Portland’s existing heavily patronized rail and “frequent service†bus routes, cost per passenger mile is LESS than the TOTAL cost of auto travel, when include the expenses of “FREE†parking  $350 billion+/- annually
JK: Of course you are using a national parking number in a comparison of Portland transit. You are also forgetting the many BILLIONs wasted on building rail.
msetty said: as well as the annual cost of oil depletion,
JK: Which trains and buses also deplete and at a higher rate than small cars. Any energy saving policy should be directed towards smaller cars, not over-priced transit.
msetty said: global warming,
JK: Utter nonsense. The tide has already turned against Al Gore’s fanaticism, as we learn more about he sun’s connection to climate changes in the past and when the news of science errors in Gore’s “hockey stick†become more widely known (see the NAS report on climate change). He will be shown to be little more that a slick Professor Harold Hill hawking mutual fund shares. See generationim.com/about/team.html
msetty said: and military adventures in the Middle East.
JK: Lets see, if the USA didn’t import oil, we would turn a blind eye on terrorist attacks on our mainland?
msetty said: These factors, plus the direct cost of driving measured in the economic statistics, are easily more than double the costs cited by Gridlock Karlock; that is, $0.40 to $50 per passenger mile overall,
JK: Be sure to apply those same fantasies to mass transit. You can start by including right of way costs which brings MAX up to over $1.10 per passenger-mile. Next allocate all road costs to transit, since we won’t have cars in your planner’s fantasy world.
BTW, according to Wendel’s excellent presentation in Portland, Houston actually reduced congestion while Portland’s transit orientation has cut our mobility by about 1/3. Another planner failure.
Thanks
JK
I appear to have forgotten to list my sources. See
http://www.DebunkingPortland.com/Transit/EuroTranistShareLoss.htm
http://www.DebunkingPortland.com/Transit/Cost-Cars-Transit(2005).htm
http://www.DebunkingPortland.com/Roads/Docs/Delucchi_Chart.htm
The NAS report is at:
http://www.nap.edu/catalog/11676.html
The Wegman report is at:
http://energycommerce.house.gov/reparchives/108/Hearings/07192006hearing1987/Wegman.pdf
Additional links:
Realclimate.org
JunkScience.com
co2science.org
climateaudit.org
Thanks
JK
Even Bjorn Lomborg says there’s global warming and man is to blame, and Wegman says nothing he has done has debunked the evidence of recent warming (since that was not what he was hired to do).
The depths of denial by delusionists cracks me up.
DS
As someone who is writing a blog about the UTA changes, this was an incredibly interesting analysis. I’ve never seen those debt numbers. I really appreciate you writing about this. Check us out at http://whereisUTA.blogspot.com
Thanks,
Nicole
First, let add this link to the Wegman report, the above link was to his written testimony:
http://republicans.energycommerce.house.gov/108/home/07142006_Wegman_Report.pdf
Dan said: and Wegman says nothing he has done has debunked the evidence of recent warming (since that was not what he was hired to do).
JK: Wegman also said the following:
Wegman:
However, in MBH98, MBH99, the proxy data are incorrectly centered, which inflates the variance of certain proxies and selectively chooses those decentered proxies as the temperature reconstruction.
….
We believe that there has not been a serious investigation to model the underlying process structures nor to model the present instrumented temperature record with sophisticated process models. 07142006_Wegman_Report.pdf, page 3
JK: MBH98, MBH99 are the papers that gave us Al Gore’s hockey stick temperature curve. Wegman just said that they incorrectly processed the data..
Wegman:
In general, we found MBH98 and MBH99 to be somewhat obscure and incomplete and the criticisms of MM03/05a/05b to be valid and compelling. We also comment that they were attempting to draw attention to the discrepancies in MBH98 and MBH99, and not to do paleoclimatic temperature reconstruction. Normally, one would try to select a calibration dataset that is representative of the entire dataset. The 1902-1995 data is not fully appropriate for calibration and leads to a misuse in principal component analysis. 07142006_Wegman_Report.pdf, page 4
JK: Again, MBH98, MBH99 are the papers that gave us Al Gore’s hockey stick temperature curve while MM03/05a/05b pointed out a number of flaws such as:
You can take red noise and put it into the algorithm used in MBH98 and get the famous hockey stick.
You can remove the bristle cone pines from the data set and the hockey stick disappears.
If you use the correct centering methodology, the hockey stick disappears.
Wegman: page 4:
In our further exploration of the social network of authorships in temperature reconstruction, we found that at least 43 authors have direct ties to Dr. Mann by virtue of coauthored papers with him. Our findings from this analysis suggest that authors in the area of paleoclimate studies are closely connected and thus ‘independent studies’ may not be as independent as they might appear on the surface.
JK: This debunks the claim that MM98 false conclusions don’t matter because they are supported by other “scientistsâ€Â. They other “scientists†are probably NOT independent.
Wegman: page 4:
It is important to note the isolation of the paleoclimate community; even though they rely heavily on statistical methods they do not seem to be interacting with the statistical community.
JK: If MBH had bothered to consult with competent stasticians at his own university, he would not have made these mistakes. Of course he would not have been able to scare the world either.
Wegman: page 4:
Additionally, we judge that the sharing of research materials, data and results was haphazardly and grudgingly done. In this case we judge that there was too much reliance on peer review, which was not necessarily independent.
JK: In other words, the peer review process failed to detect Mann’s blunders. And AL Gore is too superficial to even look into this subject which has been in the news for years.
Wegman: page 4:
Overall, our committee believes that Mann’s assessments that the decade of the 1990s was the hottest decade of the millennium and that 1998 was the hottest year of the millennium cannot be supported by his analysis.
JK: Just more debunking of Al Gore’s source.
Dan said: The depths of denial by delusionists cracks me up.
JK: And the superficiality of evidence used by the believers believe is truly amazing to me.
Even without debunking the whole paleoclimatology field, some things should have been obvious to even an idiot:
1. CO2 is, at most, 30% of the greenhouse effect and man only emits a fraction of the total CO2. I do not know the number, but if man only emits 10% of the CO2 (the real number is probably lower), then man’s effect is 10% of 30%, or THREE PERCENT of the warming. To suggest reverting to a middle age society to cure this problem is nothing short of criminal.
2. Antarctic ice cores show CO2 rising many years AFTER temperature rises. This absolutely DISPROVES CO2 as a cause of warming. The believers are hanging on by claiming that CO2 continues the warming after something unknown starts it. Laughable.
On the assumption that you will deny the above, I offer some quotes from a web site advised by Mann, the inventor of Al Gore’s hockeystick. RealClimate.org calls itself “Climate science from climate scientistsâ€Â. Its list of scientists includes Michael E. Mann, the creator of the hockey stick temperature curve that Al Gore made famous. (realclimate.org/index.php?cat=10)
From Real climate: (bold added):
In terms of mass, water vapour is much more prevalent (about 0.3% of atmospheric mass, compared to about 0.06% for CO2), and so is ~80% of all greenhouse gases by mass (~90% by volume). However, the radiative importance is less (since all molecules are not created equal).
. . . it’s clear that water vapour is the single most important absorber (between 36% and 66% of the greenhouse effect), and together with clouds makes up between 66% and 85%. CO2 alone makes up between 9 and 26%,
. . . the maximum supportable number for the importance of water vapour alone is about 60-70% and for water plus clouds 80-90% of the present day greenhouse effect. (Of course, using the same approach, the maximum supportable number for CO2 is 20-30%, and since that adds up to more than 100%, there is a slight problem with such estimates!). (realclimate.org/index.php?p=142)
And:
At least three careful ice core studies have shown that CO2 starts to rise about 800 years (600-1000 years) after Antarctic temperature during glacial terminations. These terminations are pronounced warming periods that mark the ends of the ice ages that happen every 100,000 years or so.
…All that the lag shows is that CO2 did not cause the first 800 years of warming, out of the 5000 year trend. The other 4200 years of warming could in fact have been caused by CO2, as far as we can tell from this ice core data. (realclimate.org/index.php?p=13)
JK: Yeah, Dan, The depths of denial by believers cracks me up.
Thanks
JK
The false premise, of course, that a few dead-enders still need to grasp is that showing how a first paper is not completely correct somehow nullifies anthropogenic global warming (AGW).
This, despite the existence of literally thousands of peer-reviewed papers across many disciplines describing the copious evidence that the climate is warming and mankind is mostly responsible.
The totemized first paper didn’t get the ‘handle’ right, but it got the recent past right, as everyone but a few usual suspects has said and you’ve presented no evidence to counter.
That’s right: no evidence. No data that show recent warming is normal, factoring in CO2 concs. No theory that explains how raising the atmosphric concentration of CO2 by 33% would not raise temps.
No theory, no hypothesis, no evidence, no data, no paper, no idea, no model, no equation, no abacus, no passage in the Bible, no thought, no conversation, no scribblings on a napkin, no conversation with a neighbor, no puff of smoke in the sky, no ‘nun bun’-type wish for something to be true. Nothing. Nada. Nichts. Zip.
And your ice core premise negates the fact that present conditions are not the same as in the past – in fact, for the past 650k yr CO2 ppmv haven’t been this high. Nothing that models present conditions with present CO2 should have a different temp. And you have presented no evidence why raising the ppmv conc would not raise temps, despite a century of physical evidence why it would.
In fact, 99% of the decision-makers on the planet know that AGW is real. Wingnut ideologues like Inhofe briefly get play then are subsequently ignored, but even their number shrinks by the day.
As does the tiny little group who desperately needs to marginalize the huge mountain of evidence that doesn’t comport with their belief system.
The train left the station some time ago, and delusionists are left alone on the platform; the train recedes into the distance and the few shout after it. The FUD you try to relate isn’t making a difference to decision-makers, JK. None. It’s over.
As I said, even Bjorn Lomborg says AGW happening. If the poster boy for the environment-haters says it, what does that say?
The question is where is the political will to direction society to adapt and mitigate. Because that’s the question.
DS
Dan said: The false premise, of course, that a few dead-enders still need to grasp is that showing how a first paper is not completely correct somehow nullifies anthropogenic global warming (AGW).
JK: Apparently you did not pay attention:
Wegman:
In our further exploration of the social network of authorships in temperature reconstruction, we found that at least 43 authors have direct ties to Dr. Mann by virtue of coauthored papers with him. Our findings from this analysis suggest that authors in the area of paleoclimate studies are closely connected and thus ‘independent studies’ may not be as independent as they might appear on the surface.
It is important to note the isolation of the paleoclimate community; even though they rely heavily on statistical methods they do not seem to be interacting with the statistical community.
Additionally, we judge that the sharing of research materials, data and results was haphazardly and grudgingly done. In this case we judge that there was too much reliance on peer review, which was not necessarily independent.
That adds up to complete breakdown of the peer review process and casts suspicion on all of those thousands of papers you so gleefully toss up. And they are not across many disciplines, the politically important ones are mostly from that little inbred group surrounding Mann.
Dan said: That’s right: no evidence. No data that show recent warming is normal, factoring in CO2 concs. No theory that explains how raising the atmosphric concentration of CO2 by 33% would not raise temps.
JK:
1. Can you point me to one experiment that confirms the CO2 greenhouse hypothesis?
2. How can you claim man’s CO2 is a major warming cause since all CO2 is only about 1/3 of the greenhouse effect and man only emits a small part of that. Probably man’s total CO2 greenhouse effect is around 3%. That is not an important part of the warming.
3. It is more logical to accept the warmer’s clam that CO2 did NOT cause previous warmings.
BTW: I recently read that he sun is the most active in a thousand years. Don’t suppose that could affect warming do you? Now you are the denier.
Dan said: No theory, no hypothesis, no evidence, no data, no paper, no idea, no model, no equation, no abacus, no passage in the Bible, no thought, no conversation, no scribblings on a napkin, no conversation with a neighbor, no puff of smoke in the sky, no ‘nun bun’-type wish for something to be true. Nothing. Nada. Nichts. Zip.
JK: I don’t need to present evidence, I am just relaying that fact the YOUR evidence is all suspect as this quote shows:
Wegman: page 4:
Overall, our committee believes that Mann’s assessments that the decade of the 1990s was the hottest decade of the millennium and that 1998 was the hottest year of the millennium cannot be supported by his analysis.
JK: You just lost the warmest decade argument. The previous quotes show that the whole field is suspect.
Dan said: And your ice core premise negates the fact that present conditions are not the same as in the past – in fact, for the past 650k yr CO2 ppmv haven’t been this high. Nothing that models present conditions with present CO2 should have a different temp. And you have presented no evidence why raising the ppmv conc would not raise temps, despite a century of physical evidence why it would.
JK: Got any evidence to counter said core samples? I presume if it existed, the believers at realclimate.org would have touted it instead of having to admit that we don’t know what caused said warming.
Dan said: In fact, 99% of the decision-makers on the planet know that AGW is real.
JK: 99% of the decision-makers are fools like Al Gore that haven’t even bothered to try to understand the science, they only pick up alarmist little bits and run with them.
Dan said: Wingnut ideologues like Inhofe briefly get play then are subsequently ignored, but even their number shrinks by the day.
JK: This is not about Inhofe, it is about the most respected scientists in the USA saying that the foundations of Al Gore’s BS is indeed BS.
Between the Wegman report and the NAS report we find:
1. The little ice age did exist.
2. The medieval warm period did exist.
( Neither are shown in many temeprature reconstructions, therefore those reconstructions are faulty. The methods of the Mann paper are faulty. The unspoken fact is that most of the paleoclimatology community uses these same flawed methods and thus are also deeply flawed.)
4. The data set is likewise flawed and likewise widely used by the whole bunch of them.
In summary a whole, branch of science is deeply flawed and none of its conclusions can be trusted.
BTW, before we can even call palaeoclimatology a science, it has to make successful predictions of the future. I am under the impression that they have failed at this so far.
On the other hand, another group is finding correlations and plausible linkage mechanisms between the sun and past temperature. Their data even shows the medieval warm period and little ice age, unlike Mann and his circle of “scientistsâ€Â.
It is you “chicken little†religion’s followers that is becoming the wingnuts.
Dan said: As does the tiny little group who desperately needs to marginalize the huge mountain of evidence that doesn’t comport with their belief system.
JK: And that is exactly what you are trying to do here. You are denying new analysis and serious flaws in the process that you believers use.
Dan said: The train left the station some time ago, and delusionists are left alone on the platform; the train recedes into the distance and the few shout after it. The FUD you try to relate isn’t making a difference to decision-makers, JK. None. It’s over.
JK: Yes, It’s over – for you believers – you are the delusionist and just haven’t recognized it yet.
Dan said: As I said, even Bjorn Lomborg says AGW happening. If the poster boy for the environment-haters says it, what does that say?
JK: He is not an environment-hater, he is trying to be honest in a field of charlatans and crooks. As to his AGW belief, my guess is that he also got taken in by the fraudsters.
Dan said: The question is where is the political will to direction society to adapt and mitigate. Because that’s the question.
JK: Hopefully society will learn the truth about Al Gore’s delusion (or outright dishonisty) soon enough to avoid getting too many people killed.
Lets not forget this quote form the editor of one climate journal:
DISCOVER OCTOBER 1989, Page 47:
Stephen Schneider of the National Center for Atmospheric Research described the scientists’ dilemma this way: “On the one hand, as scientists, we are ethically bound to the scientific method, in effect promising to tell the truth, the whole truth, and nothing but-which means that we must include all the doubts, the caveats, the ifs, ands, and buts. On the other hand, we are not just scientists but; human beings as well. And like most people we’d like to see the world a better place, which in this context translates into our working to reduce the risk of potentially disastrous climatic change. To do that we need to get some broadbased support, to capture the public’s imagination. That, of course, entails getting loads of media coverage. So we have to offer up scary scenarios, make simplified, dramatic statements, and make little mention of any doubts we might have.This `double ethical bind’ we frequently find ourselves in cannot be solved by any formula. Each of us has to decide what the right balance is between being effective and being honest. I hope that means being both.” (bold added – Schnider is now editor of a peer reviewed journal, Climate Change.)
Notice the line: we have to offer up scary scenarios, make simplified, dramatic statements, and make little mention of any doubts we might have – that is exactly what Al Gore is doing.
Can’t you even see that Gore is wildly exaggerating the facts? It is the classic technique of hucksters, and politicians of all stripes.
Thanks
JK
Hey, Dan, here is oppertunity to actually learn something about the state of climate research. (The NAS report came out after the closing deadline for papers for the current IPCC report, so is ignored by them)
Some Comments on the recently released
National Academy of Sciences Report on global climate change
( Report is at: http://www.nap.edu/catalog/11676.html )
The below is cut and pasted from the report with our comments in [brackets]
Surface Temperature Reconstructions for the Last 2,000 Years
Committee on Surface Temperature Reconstructions for the Last 2,000 Years,
National Research Council
From Page 111 (sheet 126) bold added:
OVERALL FINDINGS AND CONCLUSIONS
Based on its deliberations and the materials presented in Chapters 1-11 and elsewhere,
the committee draws the following overall conclusions regarding large-scale surface temperature
reconstructions for the last 2,000 years:
* The instrumentally measured warming of about 0.6?C during the 20th century is also reflected in borehole temperature measurements, the retreat of glaciers, and other observational evidence, and can be simulated with climate models.
…….[This verifies that there was about a 0.6?C temperature increase during the 20th century (see below)]
* Large-scale surface temperature reconstructions yield a generally consistent picture of temperature trends during the preceding millennium, including relatively warm conditions centered around A.D. 1000 (identified by some as the “Medieval Warm Periodâ€Â) and a relatively cold period (or “Little Ice Ageâ€Â) centered around 1700. The existence and extent of a Little Ice Age from roughly 1500 to 1850 is supported by a wide variety of evidence including ice cores, tree rings, borehole temperatures, glacier length records, and historical documents.
……[This re-affirms the existence of a “little ice ageâ€Â]
Evidence for regional warmth during medieval times can be found in a diverse but more limited set of records including ice cores, tree rings, marine sediments, and historical sources from Europe and Asia, but the exact timing and duration of warm periods may have varied from region to region, and the magnitude and geographic extent of the warmth are uncertain.
….[This re-affirms the existence of a “medieval warm periodâ€Â]
….[Remember the famous “hockey stick†chart? It DOES NOT show either the “little ice age†or “medieval warm periodâ€Â. This omission disproves the “hockey stick†chart and the data/methods used to create it. Much of the climate field uses similar data and methods.]
* It can be said with a high level of confidence that global mean surface temperature was higher during the last few decades of the 20th century than during any comparable period during the preceding four centuries. This statement is justified by the consistency of the evidence from a wide variety of geographically diverse proxies.
….[This is the headline for many newspapers. Most forgot to mention that the “preceding four centuries†started in the middle of the “little ice age (above). In other words, we are warming up after the little ice age.]
* Less confidence can be placed in large-scale surface temperature reconstructions for the period from A.D. 900 to 1600. Presently available proxy evidence indicates that temperatures at many, but not all, individual locations were higher during the past 25 years than during any period of comparable length since A.D. 900. The uncertainties associated with reconstructing hemispheric mean or global mean temperatures from these data increase substantially backward in time through this period and are not yet fully quantified.
* Very little confidence can be assigned to statements concerning the hemispheric mean or global mean surface temperature prior to about A.D. 900 because of sparse data coverage and because the uncertainties associated with proxy data and the methods used to analyze and combine them are larger than during more recent time periods.
…..[ This says that we really don’t know enough about climate before A.D 900. This suggests that we are incapable of judging today’s climate in a proper historical context, considering that there has been 12,000 years of ups and downs since the last ice age. We only know about 10% of this time span to a sufficient degree.]
———————————- From page 21 (sheet36) Bold Added ————————————
Based on the analyses presented in the original papers by Mann et al. and this newer supporting evidence, the committee finds it plausible that the Northern Hemisphere was warmer during the last few decades of the 20th century than during any comparable period over the preceding millennium.
…..[Note that this claim is only “plausibleâ€Â, not likely or probable or “supported by a wide variety of evidence†(see above)]
The substantial uncertainties currently present in the quantitative assessment of large-scale surface temperature changes prior to about A.D. 1600 lower our confidence in this conclusion compared to the high level of confidence we place in the Little Ice Age cooling and 20th century warming. Even less confidence can be placed in the original conclusions by Mann et al. (1999) that “the 1990s are likely the warmest decade, and 1998 the warmest year, in at least a millennium†because the uncertainties inherent in temperature reconstructions for individual years and decades are larger than those for longer time periods, and because not all of the available proxies record temperature information on such short timescales.
….[Here is the often heard statement that we are the warmest in 1000 years. It is given “less confidence†than “plausible†(see above). Effectively, it is shown to be baseless.]
——————————— Some Thoughts About the Above Report ——————————
We believe that the two most gripping claims about global warming have been shown to be wrong. The other major claim, that we are the warmest in 400 years is essentially a statement that we are warming after the “little ice age.†Is that bad?
—————————— Are you being lied to? ——————————
Stephen Schneider of the National Center for Atmospheric Research described the scientists’ dilemma this way: “On the one hand, as scientists, we are ethically bound to the scientific method, in effect promising to tell the truth, the whole truth, and nothing but-which means that we must include all the doubts, the caveats, the ifs, ands, and buts. On the other hand, we are not just scientists but; human beings as well. And like most people we’d like to see the world a better place, which in this context translates into our working to reduce the risk of potentially disastrous climatic change. To do that we need to get some broadbased support, to capture the public’s imagination. That, of course, entails getting loads of media coverage. So we have to offer up scary scenarios, make simplified, dramatic statements, and make little mention of any doubts we might have. This `double ethical bind’ we frequently find ourselves in cannot be solved by any formula. Each of us has to decide what the right balance is between being effective and being honest. I hope that means being both.”
From: DISCOVER, OCTOBER 1989, Page 47, bold added (Note: Stephen Schneider is founder and editor of the scientific journal Climate Change.)
—————————— Further reading ——————————
The whole NAP report: http://www.nap.edu/catalog/11676.html
The Wegman factsheet: http://energycommerce.house.gov/108/home/07142006_Wegman_fact_sheet.pdf
The Wegman report: http://energycommerce.house.gov/108/home/07142006_Wegman_Report.pdf
Website run by Mann: http://www.RealClimate.org
Website run by critic of the hockeystick: http://www.ClimateAudit.org
Here is a little analysis of the NAS report. Any comments?
Some Comments on the recently released
National Academy of Sciences Report on global climate change
( Report is at: http://www.nap.edu/catalog/11676.html )
The below is cut and pasted from the report with our comments in [brackets]
Surface Temperature Reconstructions for the Last 2,000 Years
Committee on Surface Temperature Reconstructions for the Last 2,000 Years,
National Research Council
From Page 111 (sheet 126) bold added:
OVERALL FINDINGS AND CONCLUSIONS
Based on its deliberations and the materials presented in Chapters 1-11 and elsewhere,
the committee draws the following overall conclusions regarding large-scale surface temperature
reconstructions for the last 2,000 years:
* The instrumentally measured warming of about 0.6?C during the 20th century is also reflected in borehole temperature measurements, the retreat of glaciers, and other observational evidence, and can be simulated with climate models.
…….[This verifies that there was about a 0.6?C temperature increase during the 20th century (see below)]
* Large-scale surface temperature reconstructions yield a generally consistent picture of temperature trends during the preceding millennium, including relatively warm conditions centered around A.D. 1000 (identified by some as the “Medieval Warm Periodâ€Â) and a relatively cold period (or “Little Ice Ageâ€Â) centered around 1700. The existence and extent of a Little Ice Age from roughly 1500 to 1850 is supported by a wide variety of evidence including ice cores, tree rings, borehole temperatures, glacier length records, and historical documents.
……[This re-affirms the existence of a “little ice ageâ€Â]
Evidence for regional warmth during medieval times can be found in a diverse but more limited set of records including ice cores, tree rings, marine sediments, and historical sources from Europe and Asia, but the exact timing and duration of warm periods may have varied from region to region, and the magnitude and geographic extent of the warmth are uncertain.
….[This re-affirms the existence of a “medieval warm periodâ€Â]
….[Remember the famous “hockey stick†chart? It DOES NOT show either the “little ice age†or “medieval warm periodâ€Â. This omission disproves the “hockey stick†chart and the data/methods used to create it. Much of the climate field uses similar data and methods.]
* It can be said with a high level of confidence that global mean surface temperature was higher during the last few decades of the 20th century than during any comparable period during the preceding four centuries. This statement is justified by the consistency of the evidence from a wide variety of geographically diverse proxies.
….[This is the headline for many newspapers. Most forgot to mention that the “preceding four centuries†started in the middle of the “little ice age (above). In other words, we are warming up after the little ice age.]
* Less confidence can be placed in large-scale surface temperature reconstructions for the period from A.D. 900 to 1600. Presently available proxy evidence indicates that temperatures at many, but not all, individual locations were higher during the past 25 years than during any period of comparable length since A.D. 900. The uncertainties associated with reconstructing hemispheric mean or global mean temperatures from these data increase substantially backward in time through this period and are not yet fully quantified.
* Very little confidence can be assigned to statements concerning the hemispheric mean or global mean surface temperature prior to about A.D. 900 because of sparse data coverage and because the uncertainties associated with proxy data and the methods used to analyze and combine them are larger than during more recent time periods.
…..[ This says that we really don’t know enough about climate before A.D 900. This suggests that we are incapable of judging today’s climate in a proper historical context, considering that there has been 12,000 years of ups and downs since the last ice age. We only know about 10% of this time span to a sufficient degree.]
———————————- From page 21 (sheet36) Bold Added ————————————
Based on the analyses presented in the original papers by Mann et al. and this newer supporting evidence, the committee finds it plausible that the Northern Hemisphere was warmer during the last few decades of the 20th century than during any comparable period over the preceding millennium.
…..[Note that this claim is only “plausibleâ€Â, not likely or probable or “supported by a wide variety of evidence†(see above)]
The substantial uncertainties currently present in the quantitative assessment of large-scale surface temperature changes prior to about A.D. 1600 lower our confidence in this conclusion compared to the high level of confidence we place in the Little Ice Age cooling and 20th century warming. Even less confidence can be placed in the original conclusions by Mann et al. (1999) that “the 1990s are likely the warmest decade, and 1998 the warmest year, in at least a millennium†because the uncertainties inherent in temperature reconstructions for individual years and decades are larger than those for longer time periods, and because not all of the available proxies record temperature information on such short timescales.
….[Here is the often heard statement that we are the warmest in 1000 years. It is given “less confidence†than “plausable†(see above). Effectively, it is shown to be baseless.]
——————————— Some Thoughts About the Above Report ——————————
We believe that the two most gripping claims about global warming have been shown to be wrong. The other major claim, that we are the warmest in 400 years is essentially a statement that we are warming after the “little ice age.†Is that bad?
—————————— Are you being lied to? ——————————
Stephen Schneider of the National Center for Atmospheric Research described the scientists’ dilemma this way: “On the one hand, as scientists, we are ethically bound to the scientific method, in effect promising to tell the truth, the whole truth, and nothing but-which means that we must include all the doubts, the caveats, the ifs, ands, and buts. On the other hand, we are not just scientists but; human beings as well. And like most people we’d like to see the world a better place, which in this context translates into our working to reduce the risk of potentially disastrous climatic change. To do that we need to get some broadbased support, to capture the public’s imagination. That, of course, entails getting loads of media coverage. So we have to offer up scary scenarios, make simplified, dramatic statements, and make little mention of any doubts we might have. This `double ethical bind’ we frequently find ourselves in cannot be solved by any formula. Each of us has to decide what the right balance is between being effective and being honest. I hope that means being both.”
From: DISCOVER, OCTOBER 1989, Page 47, bold added (Note: Stephen Schneider is founder and editor of the scientific journal Climate Change.)
——————————Further reading ——————————
The whole NAP report: http://www.nap.edu/catalog/11676.html
The Wegman factsheet: http://energycommerce.house.gov/108/home/07142006_Wegman_fact_sheet.pdf
The Wegman report: http://energycommerce.house.gov/108/home/07142006_Wegman_Report.pdf
Website run by Mann: http://www.RealClimate.org
Website run by critic of the hockeystick: http://www.ClimateAudit.org
Dan, Don’t miss this:
New York Temperatures Rival Record for Coldest April (Update1)
Just 10 days into April, temperatures have averaged 42 degrees Fahrenheit (5.5 Celsius), about one degree warmer than the average for April 1874, the coldest on record, said Michael Silva, meteorologist with the National Weather Service’s Upton, New York, station.
http://www.bloomberg.com/apps/news?pid=20670001&refer=canada&sid=aeVc8hq.DMng
Hey Dan, here is a little gem about Al Gore’s making money from creating a warming scare:
Proceeds from the concerts will create a foundation to combat climate change led by The Alliance for Climate Protection, currently chaired by Mr Gore.
see: http://www.dailymail.co.uk/pages/live/articles/showbiz/showbiznews.html?in_article_id=447677&in_pa
ge_id=1773
Then there is Al’s mutual fund, presumably another money maker for him.
See http://www.generationim.com/about/team.html
Thanks
JK
[Opens paper]
Huh.
[Reads]
“ConocoPhillips has joined several other major corporations urging Congress to require limits on greenhouse gases tied to global warming, the first major U.S. oil company to take such a stance.”
Gee.
[Turns page, reads]
“The Supreme Court ordered the federal government on Monday to take a fresh look at regulating carbon dioxide emissions from cars…
“In many ways, the debate has moved beyond this,” said Chris Miller, director of the global warming campaign for Greenpeace, one of the environmental groups that sued the EPA. “All the front-runners in the 2008 presidential campaign, both Democrats and Republicans, even the business community, are much further along on this than the Bush administration is.”
…The world’s leading climate scientists reported in February that global warming is “very likely” caused by man and is so severe that it will “continue for centuries.”
Golly.
[Turns page, reads]
“On Friday, Massachusetts joined Oregon, Connecticut and five other states in adopting California’s tough greenhouse gas rules, which limit the amount of carbon dioxide and other gases that can be emitted from vehicle tailpipes. These new rules would supplement federal exhaust pollutant standards already in place. Two other states are in the process of adopting the rules.”
Whaddya know.
[Turns page, reads]
“Duke Energy Corp.’s Chief Executive Jim Rogers said this morning’s release of an international report that blames humans for global warming should spur approval of a national cap on carbon dioxide he and other business leaders proposed last month.”
Wowie.
[Turns two pages, reads]
“As lawmakers on Capitol Hill push for a cap-and-trade system to rein in the nation’s greenhouse gas emissions, an unlikely alternative has emerged from an ideologically diverse group of economists and industry leaders: a carbon tax…
[A] coalition of academics and polluters now argues that a simple tax on each ton of emissions would offer a more efficient and less bureaucratic way of curbing carbon dioxide buildup, which scientists have linked to climate change.”
Even th’ polluters. Sheesh.
[Puts paper down. Pause. Looks out the rear window of the society train, to the receding station platform. Turns to companion]
“Say, who’s that jumping up and down, waving their arms?”
“Dunno. Looks like one of them delusionists or denialists or maybe a contrascientist.”
“What’s he yelling?”
“Can’t tell. We left too long ago to hear.”
“Shall we stop the train?”
“What for? What have they ever said that was worth listening to?”
“You’re right.”
[Opens paper]
Huh.
[Reads]
“Germany, the second largest market for photovoltaics, positioned itself with the 100,000 Roofs Program, launched in late 1998, which provided 10-year low-interest loans for PV installation (it ended early, in 2003, when all targets were met). Germany now leads the way with an Electricity Feed-in Law that started in 1999, which permits most customer applications to receive 45.7 euro cents per kilowatt-hour (kWh) (56¢ per kWh) for solar-generated electricity sold back to the grid.”
DS
Hey Dan,
I see you have completely run out of rational arguments and now resort to saying eveyone believes.
* Well everyone used to believe the earth was flat. They were wrong.
* Everyone used to believe thee sun went around the earth. They were wrong.
* People used to believe the gods made the weather. They were wrong.
You are simple wrong. What little evidence the believers ever had is rapidly dissolving under their irrational feet.
Thanks
JK
Dan, since you like Lomborg, here is a report of something he said:
Do they also disagree with Bjorn Lomborg, author of “The Skeptical Environmentalist”? He says: Compliance with Kyoto would reduce global warming by an amount too small to measure. But the cost of compliance just to the United States would be higher than the cost of providing the entire world with clean drinking water and sanitation, which would prevent 2 million deaths (from diseases like infant diarrhea) a year and prevent half a billion people from becoming seriously ill each year.
http://www.townhall.com/columnists/GeorgeWill/2007/04/12/the_media_and_global_warming
Thanks
JK
Dan,
Since you are fan of “peer reviewâ€Â, have a look at these “peer reviewed†articles:
It is concluded that changes in the earth’s orbital geometry are the fundamental cause of the succession of Quaternary ice ages
Variations in the Earth’s Orbit: Pacemaker of the Ice Ages Science 10 December 1976: Vol. 194. no. 4270, pp. 1121 – 1132, DOI: 10.1126/science.194.4270.1121)
Length of the Solar Cycle: An indicator of Solar Activity Closely Associated with Climate, Science 1 November 1991: Vol. 254. no. 5032, pp. 698 – 700, DOI: 10.1126/science.254.5032.698
Thanks
JK
Dan,
Be sure to see this little history of the climate change concern:
http://www.saveportland.com/Climate/index.html
Thanks
JK