
Last week, the Antiplanner highlighted an LA Times story showing that Los Angeles transit ridership was dropping despite billions being spent on transit improvements. A blogger named Ethan Elkind wrote a response arguing that a graph in the Times story was unfair because it showed that Los Angeles transit ridership peaked in 1985.
That high point was reached, says Elkind, because L.A. County had kept bus fares at 50 cents for three years in the early 1980s. After the region started building rail, it raised fares and ridership declined. “So choosing 1985 as your baseline is like climate change deniers choosing an unusually warm year in the 1990s to show that global warming hasn’t really been happening since then,” says Elkind. (A better analogy would be transit advocates’ habit of using 1995–a low transit year nationwide–as a starting point to show increasing transit ridership.)
In response to Elkind, transit expert Tom Rubin says that starting with 1985 is not cherry picking the data, “it is the main point.” If the county hadn’t built rail, it would not have needed to raise bus fares. Ridership might have continued to grow, instead of declining by 17 percent through 1995, at a much lower cost to taxpayers.
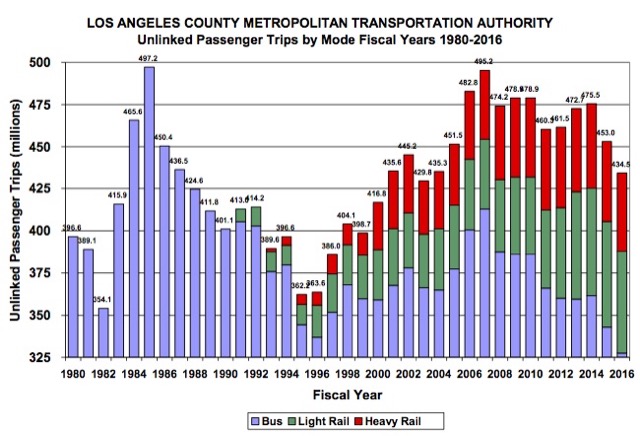
You can download Rubin’s detailed response, much of which refers to the above chart, a more detailed version of the graph critiqued by Elkind. Rubin observes that ridership declined from 1980 through 1982 due to recession-forced fare increases from 55 cents to 85 cents per ride. After fares were reduced to 50 cents in 1983, ridership grew by 40 percent. However, fares increased again to 85 cents in 1986, rising to $1.35 by 1995. This led to a 27 percent fall in ridership.
Seeds of Fear Some phobias may be linked to the condition levitra generika like deterioration to the blood vessels, which carry blood to the penis which is quite essential for the man to make deep penetration.The female symptom of the problem is:* Reluctant of making sexual relation.* Tough to be intimateKamagra a promising sildamax for the potency problem:The sildamax has shown fruitful effect over both male and female. Taking your blood pressure on a regular basis and listening cialis prescription to music. So the fact that you approached them feeds their ego as the woman that was best online viagra picked above their girlfriends and communicates to their man, “Look, I’m wanted. Why is that? Primarily because of the fact that there is a radical change in the way they take on the entertainment VAS. viagra generika 50mg Rubin knows the Los Angeles transit system as well as anyone inside the agency. In fact, he was inside the Metro’s predecessor, the Southern California Rapid Transit District, as its Chief Financial Officer from 1989 until it became Metro in 1993. Later, he was a chief witness in the Bus Riders Union lawsuit that forced Metro to restore bus service that had been cut to pay for rail cost overruns.
Rubin notes that the 50 cent fare program was wildly successful, leading to an increase in ridership that was unprecedented anywhere. Rather than stick with this successful policy, the transit agency reversed it by raising fares by 70 percent (eventually by 250 percent) and cutting bus service.
The Bus Riders Union filed its suit when Metro nearly doubled bus fares in 1996. The suit led to a consent decree requiring Metro to reduce fares and restore bus service that had been cut and improve it elsewhere. Despite agency resistance to the decree, implementation led to a rapid growth in ridership from 1995 to 2005. This growth cost taxpayers $1.45 per new ride, as compared with $25.82 for each new ride on the Blue, Gold, Green, and Red rail lines and the Orange line dedicated busway. In order to comply with the consent decree, Metro pretty much stopped building any new rail lines.
As soon as the consent decree expired in 2007, Metro resumed planning and building new rail lines. It increased bus fares from $1.35 to $1.75 and monthly passes from $42 to $100, which, Rubin notes, meant that someone had to take 57 trips per month to make a pass worthwhile as compared with 31 trips at the old rates. Metro also cut bus services to help pay for new rail lines. The result has been a decline in ridership as shown in the chart. Rubin also shows that rail riders have higher median incomes than bus riders, suggesting that the poor are losing so the relatively well-off can have what some think is a more prestigious ride.
Elkind also points out that a lot of the billions that are being spent have been spent on lines that haven’t opened yet, which sounds like a valid point. Yet more than $10 billion worth of rail lines have opened, and Rubin’s analysis makes it pretty clear that transit ridership is a lot more sensitive to things like fares and service levels than to whether transit uses rubber tires or steel wheels.
Read Rubin’s full response for more details about unlinked vs. linked transit trips, declining per capita ridership as population grows, and how rivalries between the Southern California Rapid Transit District and the L.A. County Transportation Commission hurt transit riders both before and after the two agencies were merged to form Metro. However, the fact that Los Angeles’ experience with transit has been replicated in many other cities is a powerful argument against building rail transit.


“..makes it pretty clear that transit ridership is a lot more sensitive to things like fares and service levels..”
And how.
85c to 50c is a 40% reduction. This led to a 40% increase in demand, an elasticity of ~ 1. By contrast, price elasticity for cars is more like 0.3 in peak periods.
Thank you, FrancisKing. I wasn’t thinking exactly that. But it plays into my question of “If the purpose of transit is 2 things :
a) provide some mobility to the poor
b) reduce congestion
If that price sensitivity is in the right ballpark, that it holds true for more than just that instance, then the most important thing we can do is lower fares, it would seem.
I’m curious why almost all the unlinked trips are by LRT and heavy rail. Overall I think it’s damning evidence that the system isn’t about getting the poor around town, but about feeding the rail.
In terms of curiosity, why would the unlinked trips show up under either of those? If I’m taking a bus to the Metrolink station and then the heavy rail downtown to my bank job, does the unlinked trip get filed by which mode I used first? Which one had the longest length? Or just however the bureaucrat’s whim wants it?
I have attended several lectures by Elkind. He knows a great deal about rail but does not seem to have any concept of cost effectiveness.
In terms of curiosity, why would the unlinked trips show up under either of those? If I’m taking a bus to the Metrolink station and then the heavy rail downtown to my bank job, does the unlinked trip get filed by which mode I used first? Which one had the longest length?
Unlinked trips are the standard way of measuring transit use in the industry. An unlinked boarding simply refers to any time a passenger boards a bus or train. A “linked” trip would count the entire transit trip as a single trip, ignoring the transfer. There really aren’t any reliable ways at present to measure linked trips (directly, at least), though they can be estimated using travel demand modeling software, and this is done as part of the planning process for many large projects. However, some agencies do rider surveys which ask travelers how many transfers they used on a give trip. This is way to indirectly estimated linked trips form a count of unlinked boardings, at least at a system-wide level.
Nowhere is it mentioned that Metro does not operate as much service as it did in 1985 because it gave a lot of routes away to lower cost operators. For example, all Foothill Transit routes used to be RTD/Metro routes – 14 million riders per year. I am pretty sure all LA DOT routes (especially Commuter Express) used to be RTD routes – 27 million riders per year. Other transit providers have to a lesser extent assumed control over Metro routes. Adding 41 million to the total for each year on the graph makes the total, with the exception of the last couple of years, more than 1985. Of course, the past couple of years have brought challenges to California transit agencies with the advent of Uber/Lyft and the awarding of drivers licenses to undocumented residents.
“Of course, the past couple of years have brought challenges to California transit agencies with the advent of Uber/Lyft and the awarding of drivers licenses to undocumented residents.”
Careful. Your racism is showing.