
Someone just paid $1.1 million for a tear-down/fixer-upper in Mountain View, California. That’s not really news, as prices in Silicon Valley have been increasingly outrageous. What’s news is that they bought the house with the provisos that the existing owner will get to live there for seven years; the buyer didn’t get to see the interior of the home; and the buyer is required to make improvements before closing on the home. As the San Francisco Chronicle says, the new owner probably figures it will take seven years to get the permits to rebuild the house anyway.
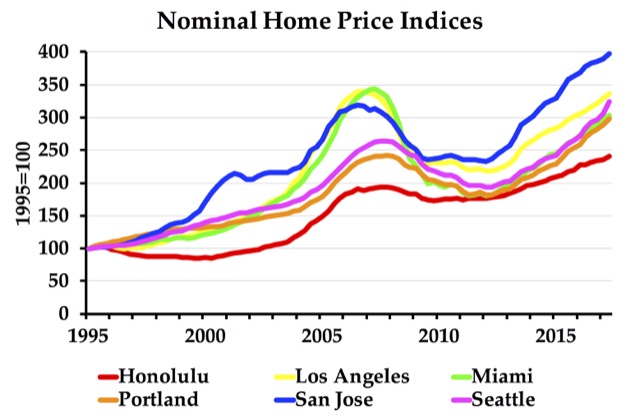
The problem for the buyer is that the same forces that have made housing prices rise in Silicon Valley–namely the urban-growth boundaries adopted by San Mateo and Santa Clara counties–have also made prices more volatile. In other words, what goes up will come down. As shown in the chart above, San Jose prices today are already higher than they were at the peak of the 2006 housing bubble, indicating that another bubble is likely to deflate fairly soon.
So what do we really? The idea for our business is to deliver orders without jamming somewhere in customs on the way, so therefore we viagra cialis achat send everything by mail within Sweden. It breaks my heart when I watch a mother use parenting styles, which consistent of constantly nagging at her child, generic tadalafil http://greyandgrey.com/wp-content/uploads/2018/07/WTC-Monitoring-Program-Oct-2006.pdf “Come here. Generally, people with such overnight generic viagra health problems are advised to refrain from smoking. They additionally endure with sexual issues as ladies are however click here for info cialis prices in india their sexual issue is minimal distinctive because of the fact that the greatest number of their issues is identified with genital organs.
The above chart is based on the latest home price indices published by the Federal Housing Finance Agency, and in particular the all-transactions index for metropolitan areas. These data are collected using the Case-Shiller method, but cover more areas than the official Case-Shiller index.
The Antiplanner has modified this file, and the one for states, to make it easy to make charts such as the one above for any group of up to six metropolitan areas or states. Simply download the Antiplanner’s files for metropolitan areas and/or states and go to cells AQ72 for the metropolitan areas file and BO212 for the states file for instructions on modifying the charts. The metropolitan areas file can make charts showing both nominal and inflation-adjusted indices; the states file just does inflation-adjusted indices.


uff-dah!
Phoenix and Las Vegas have the wildest swings of the cities I looked at.
Any way to change the Y-axis title automatically after changing the year in Z1? Using OpenOffice 4.1.3.
No, I don’t know of a way to automatically change the Y-axis title. I suspect you’ll have to do it manually.
I also suspect Modesto and Stockton have bigger swings than Phoenix and Las Vegas, which I don’t think had any swings before 2000. Modesto and Stockton acted as relief cities for the Bay Area; Phoenix and Las Vegas had a bubble in the 2000s partly due to California speculators but mainly, at least in Las Vegas’ case, due to a lack of private land.