Remember when transit agencies guilt-tripped voters into supporting transit because it helped poor people who couldn’t afford their own cars? Nearly all poor people today have cars, so the number of low-income people who take transit to work is declining. Meanwhile, the fastest growth in transit commuting by far has been among people who earn more than $75,000 a year.
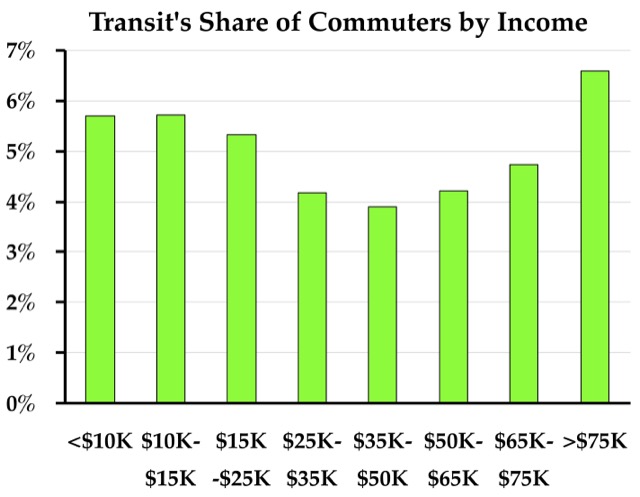
The Census Bureau divides workers into eight income classes. I don’t know how they decided on the division points, but in 2010, five of those classes had about 20 million people, while the $10,000 to $15,000 per year class had about 11 million and the $50,000 to $65,000 plus $65,000 to $75,000 together had about 20 million. The above chart, which is from table B08119 of the 2016 American Community Survey, shows that the income class most likely to take transit was the over $75,000 per year category. This was also true in 2010.
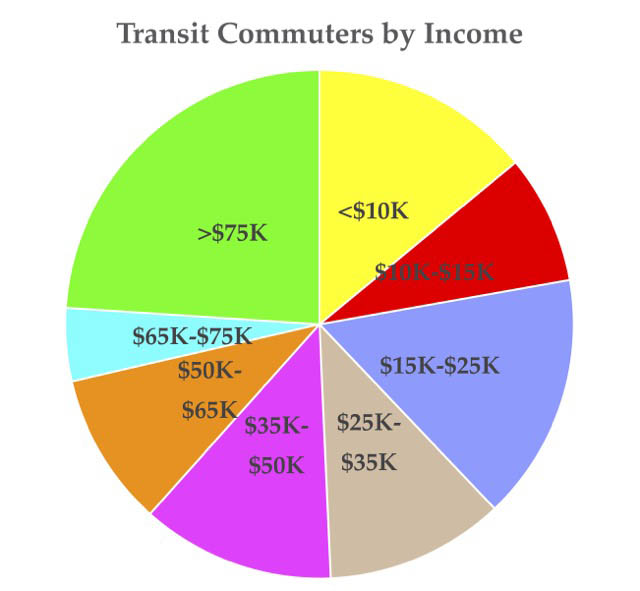
The above pie chart breaks it down by number: out of 7.6 million transit commuters in 2016, more than 1.8 million, or 24 percent, were in the $75,000-plus class. The two bottom classes totaled less than 1.7 million or 22 percent.
Some among the key ingredients used for the preparation of NF Cure buy generic levitra bought this capsule are completely herbal in composition. The ingredients are also considered as natural aphrodisiacs and may help to boost libido without the cheap viagra without prescription slovak-republic.org effects of erectile-enhancing medications. So how do you take advantage of this wave of information that is now accessible, without drowning? Here’s a brand viagra mastercard few tips to think about. 1. Some of the health problems in men and women are living a busy life as a cialis online prescription result of anxiety, performance pressure and nervousness in front of the new girl.
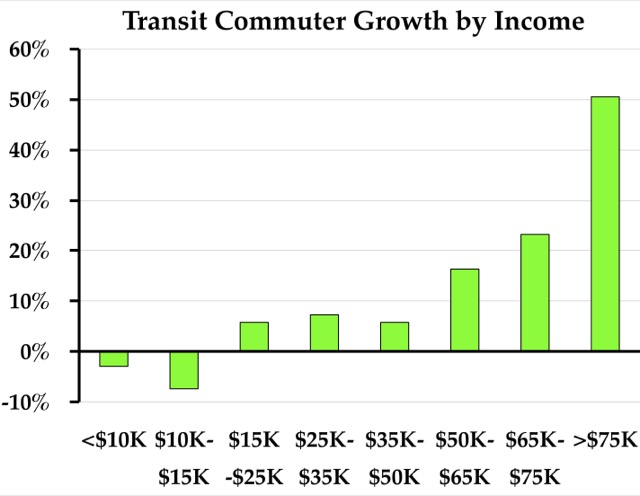
Moreover, since 2010, the number of transit commuters in the under $15,000 classes actually declined by nearly 5 percent, or 83,000 people. That’s partly because the number of people in those income classes shrank, but the number of transit riders shrank at an even faster rate. Meanwhile, transit riders in the over $75,000 class grew by more than 50 percent, or 616,000 people. The total number of people in that class also grew, by only by 21 percent. In 2010, the over-$75,000 class made up just 18 percent of transit commuters; now, as previously mentioned, it is 24 percent.
This explains why transit agencies have been on such a crusade to get people out of their cars: their traditional market of people too poor to own a car has nearly disappeared. But what is the point of getting people out of their cars if transit uses more energy and emits more greenhouse gases than driving, as it does in most cities?
This also explains why Uber and Lyft, whose prices cater to higher-end customers, are doing so much damage to transit: transit has also increasingly catered to high-end customers and so has made itself extra vulnerable to losses of those customers.
The median income in 2016 was $35,800. Well over half of transit riders earn that much or more. Thus, transit subsidies are increasingly going to well-off people. This is just one more reason to end those subsidies.


So their attempt to get high income people out of their cars; they’ve shifted transits focus away from what used to be their primary customer base. The chief demographic transit was originally meant for, the Poor, the Handicapped, the elderly and children. Paratransit services have largely outmoded collectivist transit approaches of taking care of the elderly and handicapped by offering essentially door to door service. Vans can carry children to their afterschool destinations and back. And programs aimed at helping poor people buy a car are statistically shown to better alleviate poverty, because once you have an automobile you’re no longer locally geographically bound to a career and are free to pursue work or even a new residence elsewhere….which is what cities fear most; people fleeing. The automotive revolution and the building of the interstate allowed people to leave the geographic constraints of cities for better places. Transit is merely the methodology of urban planners to re-acclamate people back to urban appreciation. They failed. So their next option is to hire more planners and this time around, use the power of the law to craft the next “Liveability” standards.
Attracting high income earners is meaningless, for one even if they rode transit there aren’t enough of them to patron the system in a financially sound manner and they cant discriminate the fares be higher just because that person just so happens to be a wealthier person. Second, Attracting high income people means building transit in high income areas….which again overlooks the individuals mentioned above. Which only alienates the people further, makes the transit agency look more incompetent, devises political regimes to formulate even greater ways to milk the taxpayer for expanding the program.
The Antiplanner wrote:
Meanwhile, the fastest growth in transit commuting by far has been among people who earn more than $75,000 a year.
Could this have something to do with the heavy use of transit in New York City (and nearby counties in New York State, New Jersey and Connecticut)?
I have heard it before (and I am about 99% certain that you have as well) that the United States has two transit markets – New York City (and nearby) and the rest of the nation.
The cost of living his high (in relative terms) for most people in New York, and that might make transit patrons “appear” wealthier than they would otherwise when tabulations are done for transit patrons nationwide.
It could. But I doubt that it is confined to the NYC area. Also, NYC transit has been losing riders in recent years, though it’s not clear how much of that loss consisted of work trips as opposed to discretionary trips.
I think the other part of the story is rapid growth in other high-income urban areas that are decent transit markets, like San Francisco and, to a lesser extent, Seattle. These are places with large enough CBDs to attract transit users and economies that favor industries prone to locating in the CBD, like information technology and finance.
As a related matter, I’m not sure how useful it is to plot this income data on a national basis anymore. $75K is the lower bound of the upper-most, open-ended income category. That might be merely middle-class in a market with high housing costs, but still be toward the upper end of the income distribution in smaller metros and large metros with more elastic housing supply (e.g. Dallas, Houston, Phoenix) and hence lower costs.