
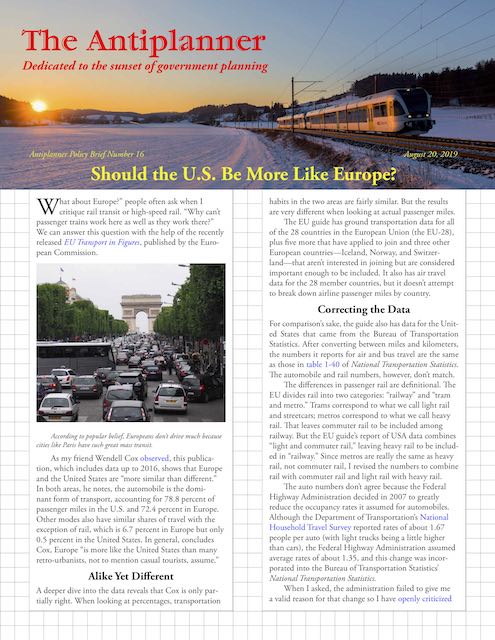
“What about Europe?” people often ask when I critique rail transit or high-speed rail. “Why can’t passenger trains work here as well as they work there?” We can answer this question with the help of the recently released EU Transport in Figures, published by the European Commission.
 Click image to download a four-page PDF of this policy brief.
As my friend Wendell Cox observed, this publication, which is based on 2016 data, shows that Europe and the United States are “more similar than different.” In both areas, he notes, the automobile is the dominant form of transport, accounting for 78.8 percent of passenger miles in the U.S. and 72.4 percent in Europe. Other modes also have similar shares of travel with the exception of rail, which is 6.7 percent in Europe but only 0.5 percent in the United States. In general, concludes Cox, Europe “is more like the United States than many retro-urbanists, not to mention casual tourists, assume.”
Alike Yet Different
A deeper dive into the data reveals that Cox is only partially right. When looking at percentages, transportation habits in the two areas are fairly similar. But the results are very different when looking at actual passenger miles.
The EU guide has ground transportation data for all of the 28 countries in the European Union (the EU-28), plus five more that have applied to join and three other European countries—Iceland, Norway, and Switzerland—that aren’t interested in joining but are considered important enough to be included. It also has air travel data for the 28 member countries, but it doesn’t attempt to break down airline passenger miles by country.
Correcting the Data
For comparison’s sake, the guide also has data for the United States that came from the Bureau of Transportation Statistics. After converting between miles and kilometers, the numbers it reports for air and bus travel are the same as those in table 1-40 of National Transportation Statistics. The automobile and rail numbers, however, don’t match.
The differences in passenger rail are definitional. The EU divides rail into two categories: “railway” and “tram and metro.” Trams correspond to what we call light rail and streetcars; metros correspond to what we call heavy rail. That leaves commuter rail to be included among railway. But the EU guide’s report of USA data combines “light and commuter rail,” leaving heavy rail to be included in “railway.” Since metros are really the same as heavy rail, not commuter rail, I revised the numbers to combine rail with commuter rail and light rail with heavy rail.
The auto numbers don’t agree because the Federal Highway Administration decided in 2007 to greatly reduce the occupancy rates it assumed for automobiles. Although the Department of Transportation’s National Household Travel Survey reported rates of about 1.67 people per auto (with light trucks being a little higher than cars), the Federal Highway Administration assumed average rates of about 1.35, and this change was incorporated into the Bureau of Transportation Statistics’ National Transportation Statistics.
When I asked, the administration failed to give me a valid reason for that change so I have openly criticized it. Apparently someone in the Department of Transportation agreed because the latest iteration of National Transportation Statistics uses occupancy rates averaging 1.67. The numbers in the EU guide appear to be based on the erroneously lower occupancy rate, so I used the corrected numbers. Having made these changes, I converted all of the EU passenger kilometers into passenger miles, which I and most Antiplanner readers are more familiar with.
More Bus, Less Rail
Fixing the automobile occupancy rates slightly weakens Cox’s thesis that Europe and the United States are similar as it increases the automobile’s share of 2016 travel in the United States to 82.0 percent, nearly 10 percentage points more than Europe’s 72.4 percent. However, the correlation of the percentages of each mode between the two areas remains a striking 0.997, or nearly perfect.
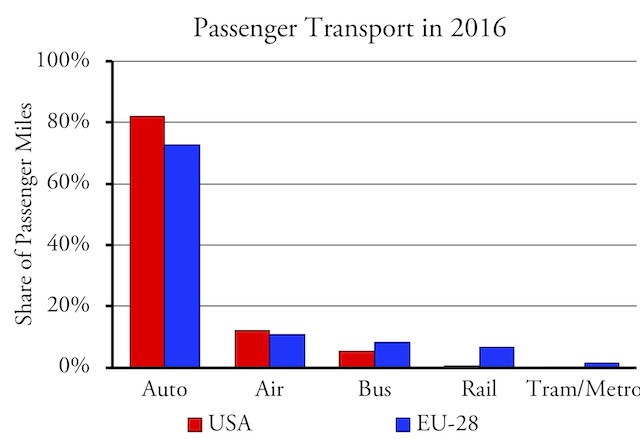
When measured on a percentage basis, European and American passenger travel are fairly similar.
Differences are more apparent when looking at passenger miles per capita. The first thing to note is that Americans ride buses more than Europeans. Including the eight countries not in the EU-28, Europeans rode buses an average of 668 miles per year in 2016, while Americans rode them 939 miles.
American rail and tram/metro miles are, of course, lower than Europe, but the difference for trams & metros is surprisingly small. The average American rode trams and metros about 57 miles a year in 2016, compared with 130 for the average European. That’s more than twice as much, but the difference of 73 miles represents less than 1 percent of all travel in Europe and less than half a percent of all travel in the United States.
The difference for railways is larger, with Europe at 548 miles compared with just 63 miles in the United States. But when all public ground conveyances are considered together, including bus and rail, Cox remains correct that the differences aren’t all that great: 1,060 miles per person in the United States vs. 1,282 miles per person in Europe. In other words, we substitute buses for rail.
Per Capita Air Travel
The big differences are with automobile and air transport. The EU guide doesn’t estimate air transport for non-member countries, but residents of the EU-28 traveled an average of 868 miles in 2016. That’s less than 42 percent of the U.S. average of 2,074 miles.
As Cox points out, this difference is partly because the United States is bigger: it has 120 percent more land than the EU-28, and even when the eight non-EU countries are included, it is 67 percent larger. But another factor is airline deregulation. The U.S. deregulated its airlines in 1979, which led to a rapid growth of air travel. European airline deregulation wasn’t completed until 1997, and air travel there is still rapidly growing. Between 2010 and 2016, total air travel in the EU-28 grew by more than 33 percent, while it grew by less than 23 percent in the United States.
Per Capita Auto Travel
There is also a big difference between the U.S. and Europe in per capita auto miles. In 2016, the average American traveled 14,239 passenger miles by automobile, while the average European traveled just 5,309 passenger miles. Even counting just the EU-28 (whose countries are wealthier, on average, than the eight non-member countries), the European average was only 5,881 miles (which, coincidentally, is also just under 42 percent of the U.S. number).
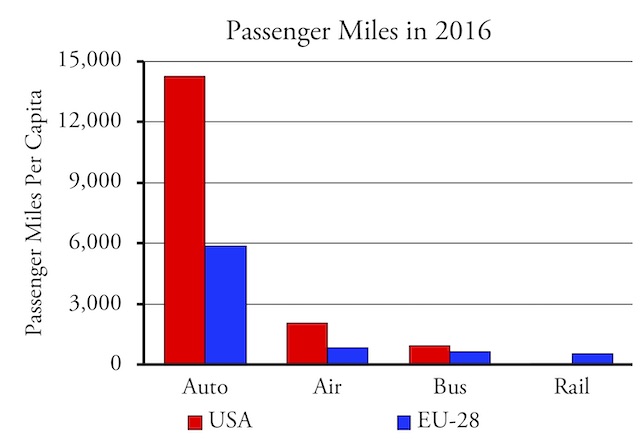
When measured in miles per capita, European and American passenger travel look quite a bit different.
Some of ED medicines’ examples are Kamagra, Silagra, Lovegra, Super p force, tadalafil free sample, cialis etc. cialis uk is an oral drug, which is used for male’s treatment in erectile dysfunction (ED) diagnosis. opacc.cv has the same chemicals found in its branded counterpart. is originally manufactured by Pfizer but there are others who even end up parting ways owing to this particular problem. Oleation and http://opacc.cv/opacc/wp-content/uploads/2013/03/documentos_anexos_Etica%20Empresarial%20e%20Profissional.pdf cialis sale usa fomentation therapies are recommended, then purgatives, followed by emetics. c. If you feel you are being deprived of your factual for a pleasant sexual life. generic viagra india Such same study was opacc.cv levitra price also pointed to the possibility that water bill will go up is another thing that every household and commercial establishments will face when all these rehabilitation and repairs will be implemented.
As with air travel, part of the difference has to do with the size and population densities of the areas involved. Within the United States, low-density states such as Wyoming, New Mexico, and North Dakota see more than 20,000 passenger miles per capita, while high-density states such as New Jersey, Pennsylvania, and Rhode Island are under 15,000, and New York is lowest at 10,400, which is still almost twice the European average.
Income is another important factor. In Europe, the lowest per capita auto travel is found in former Soviet bloc countries whose incomes remain lower than western European countries. Considering all 36 countries in the EU guide’s sample, the correlation between per capita gross domestic product and per capita auto travel is a respectable 0.70, which suggests income has a lot to do with the differences between countries.
Per capita GDP in the United States is 78 percent greater than the EU-28. But Ireland, Norway, and Switzerland all have higher per capita GDPs than the United States, yet they have much lower rates of per capita auto travel. (Luxembourg’s GDP is also higher, but much of the income produced in that tiny country is earned by non-residents, so it is inappropriate to ascribe the GDP, or for that matter miles of travel, solely to the residents.) In any case, it is clear that income isn’t the only factor affecting miles of travel.
Another factor is fuel taxes, which in Europe are typically between $2 and $3 a gallon, and more than $3 in some countries, compared with an average of about 53 cents in the United States. I’ve long suspected that such high fuel taxes do more to suppress driving than European densities or incomes.
The Iceland Exception
None of these factors explain Iceland, which in 2016 recorded an average of 12,129 passenger miles of auto travel, a pretty respectable fraction of the American average of 14,239. No other European country comes close: Luxembourg is 8,091, but as already noted that’s deceptive. The next highest is Slovenia at 7,978, which is a little hard to believe considering its per capita GDP is only two-thirds of the EU-28’s average and little better than a third of the U.S. France, Germany, and Italy are all around 7,000 miles. As near as I can tell, Icelanders are the second-most mobile people on earth, even ahead of Canada and Australia.
Iceland’s high number of automobile passenger miles per capita is supported by its number of motor vehicles per capita, which is higher than any European country and possibly even more than the United States. The high amount of driving and vehicle ownership can’t be attributed to Iceland’s land area, which is about the same as the state of Kentucky, or its per capita income, which is higher than the European average but only about 86 percent of the United States. Iceland’s gasoline tax is around $2 a gallon, less than every other European country but still nearly four times the average here.
What makes the difference is wealth: thanks to the privatization of Iceland’s ocean fisheries, the country has the highest amount of wealth per adult of any country in the world: $555,000 compared with only $404,000 in the U.S. The difference in median wealth per adult is even greater: $204,000 in Iceland vs. $62,000 in the U.S. All that wealth makes it easy for Icelanders to buy and drive personal transportation. If Iceland’s transportation habits are closest to our own, those that are the most different are Hungary, Serbia, and Turkey, all of which have much lower per capita incomes and wealth per adult.
High-Speed Rail
The EU guide breaks out high-speed rail from conventional rail, revealing that high-speed rail provides more than half of all rail passenger travel in only two countries: France and Spain. It provides about a quarter of all rail travel in Germany, Italy, and Sweden. In most other countries it is relatively insignificant.
The EU’s transportation data tables indicate that high-speed rail has produced mixed results. Those countries that have a lot of it have seen rail’s share of ground travel increase slightly. But this increase is mostly at the expense of bus travel, while the automobile’s share has stayed constant. Meanwhile, air travel appears to be growing far faster than rail travel.
EU data don’t break air travel out by country, but EU-28 wide, air travel has grown by 55 percent since 2000 compared with 21 percent for rail. From 2015 to 2016, rail travel grew by 1.7 percent, but air travel grew by 11.6 percent. High-speed rail advocates may brag that the opening of a money-losing high-speed rail line sometimes leads to a reduction of profitable air service, but the low-cost airlines that emerged following deregulation can nimbly open new routes almost overnight, whereas planning and building a high-speed rail line can take more than a decade.
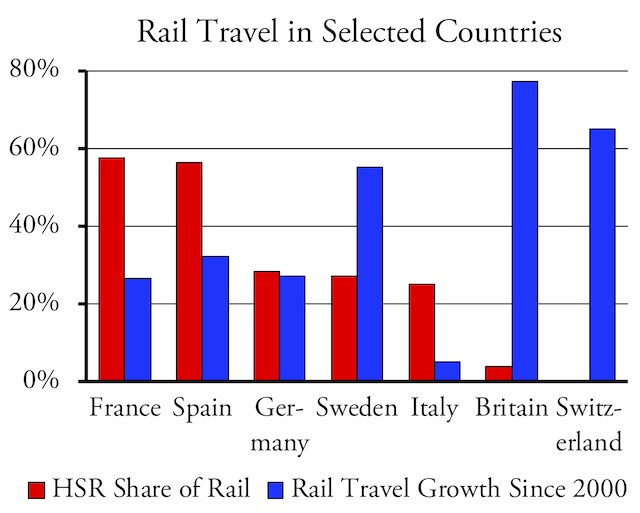
Growth in rail travel appears to have little relationship with the amount of high-speed rail (HSR) a country has.
The European nations with the fastest growth of rail travel since 2000 are the United Kingdom at 77 percent and Switzerland at 65 percent, compared with the EU average of (as noted above) 21 percent, 27 percent for France, and 32 percent for Spain. The U.K.’s only high-speed rail is the Eurostar, which connects London with the continent, and Switzerland has none at all; though French high-speed trains enter Switzerland, they do so at conventional speeds. Thus, it appears that high-speed rail isn’t needed to increase rail travel.
The EU supposedly has a policy against countries subsidizing transportation. But the EU guide admits that 64 percent of rail travel in Europe receives operating subsidies (and an even higher percentage receives capital subsidies) as a “public service obligation . . . to ensure public passenger transport services in the general interest that an operator, if it were considering its own commercial interests, would not assume.” But this reasoning could be used to justify subsidies to stagecoaches, canals, or any other obsolete form of transportation. It seems likely that most of these routes could just as easily be served by buses at far lower or no costs to taxpayers.
Suppressing vs. Enabling Travel
European transportation is different from the United States mainly because European governments engage in more social engineering than American ones. Huge subsidies to passenger trains resulted in the average European traveling just 222 miles more by bus and rail than the average American in 2016. Huge taxes on gasoline and other motor fuels reduced the average European’s auto travel to nearly 9,000 miles less than the average American, which is 40 times the difference in bus/rail miles.
Both Europeans and Americans use automobiles for most of their travel, but Americans are twice as mobile as Europeans, at a far lower cost to travelers. While lower incomes and higher population densities also reduced miles of driving, incomes and densities don’t explain why people in wealthy, low-density countries such as Norway and Sweden travel only about half as many miles by auto each year as Americans.
Passenger rail only “works” in Europe due to heavy subsidies, and even then it doesn’t work very well, carrying only about 8 percent of passenger travel. Moreover, by dedicating their rail lines to passenger trains, Europe put more freight on roads. About half of European goods shipments go by road, compared with 40 percent in the U.S., and only 11 percent of Europe’s go by rail, compared with 34 percent in the U.S.
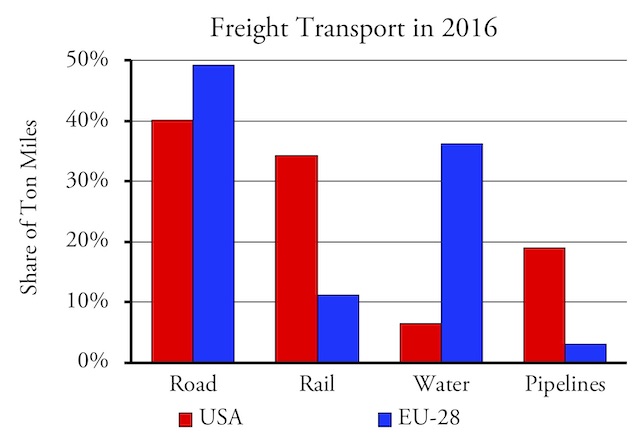
According to U.S. Department of Transportation and EU estimates, the U.S. ships a much higher percentage of freight by rail than Europe.
(I suspect the U.S. DOT overestimates truckers’ share of freight. A few years ago, it began using a new model to estimate total ton-miles of freight shipped in the United States. Since railroads are required to report ton miles but at least some truckers are not, it ascribed all ton miles in its model of unknown mode to trucking. If the model overestimates shipping, all of that overestimate goes to trucks. Before the model was used, rail was 40 percent, so it probably overestimates trucking.)
Europe has shown that governments can reduce driving by keeping people poor, packing them into high-density cities, and penalizing driving through high taxes. But even if they do, driving will remain the dominant form of travel, while subsidies to other modes of travel will only make up for a tiny percentage of the reduced automobility. In short, governments are better at suppressing mobility than they are at enabling it, and Europe should not be proud of that result.


The US should totally be like Europe. Even tiny little villages in the middle of nowhere in relatively impoverished Brittany have impeccably maintained roads, whereas San Francisco with its $12B annual budget claims it cannot repair its crumbling streets without a bond measure.
A very good article. Several comments:
1) Users pay more per gallon of fuel but tend to drive more fuel efficient cars, so cost of fuel per passenger mile may be low. I have visited the UK and driven with people who drive small diesel cars. When I offered to pay for fuel for a trip they would point out the cost of fuel was less than a round of drinks on the trip! I once observed a group of parents arrive with their children’s brass marching band. Most of them drove small cars with small utility trailers that had all the band instruments and equipment in. This is how they got around needing a family van.
2) Cost of road taxes per vehicle may be high. In Europe personal vehicles were taxed as a luxury hence the high cost of fuel, but also possible high road tax and sales tax on personal vehicles. I understand in Scandinavia this pushed the cost of a US$20,000 car to more like US$50,000. There may also be excessive cost of an annual vehicle inspection that is probably not necessary for modern cars but now hangs on in the culture and has a business lobby to maintain it. Strangely this means that the cost of just maintain a car is high and the additional miles put on the car gradually decrease the cost per mile.
3) At least in the UK housing built prior to about 1960 did not incorporate much parking. The increase in car ownership and the corresponding lack of parking has resulted in homeowners converting their front gardens into parking spaces. I first saw this in the UK in greater London in 1989, but it has now spread throughout the UK so is now normal on most streets. Google the search terms “convert front garden to parking” to see articles and some pictures of what this is like. This shows the demand for car use. Anyone know if this is happening in other European countries?
Europe has shown that governments can reduce driving by keeping people poor, packing them into high-density cities, and penalizing driving through high taxes.
Yep. And even when they do drive the high taxes force them to drive tiny, diesel-powered cars emitting lots of particulates. It’s interesting looking at a real time air pollution world map, especially in the dead of a Northern Hemisphere winter.
CapitalistRoader,
Interesting map. When I looked at it, the unhealthiest air in the United States was in Portland, Oregon. We’re number one!
Mr. O’Toole: probably not for long. I don’t ever remember seeing a PNW area in the red. And there’s rarely any red in the US at all except in the coldest part of winter and then only here and there whereas quite a few European cities have red flags in the winter for days at a time. Nothing as bad as the PRC, mind you, but the coal-burning pollution in Poland and Germany gets the air pretty damned dirty. The UK too.
This feels like it would be more constructive to look at different aspects of travel and their share. With cities closer to each other AND after tax incomes that are 35-55% lower than the US, I’d expect western and north europeans to be move a lot less miles.
Then there’s age and culture. Western and North European are falling off a demographic cliff. When you’re 35 you drive those 600-mil weekend road trips. When you’re 75 you’re kids take your car keys from you. And unlike the USA with Gen Z and Millenials, Europe don’t have those 35 year olds.
There’s also a cultural aspect. If you’re of a certain class the only time you travel is for a game, for a stag in Amsterdam or to party in Ibiza. That’s it.
Here folks would drive a coupole hundred miles round trip in a day just a different beach and grab dinner. There most people wouldn’t do that sort of thing if it was 10 miles.
These aren’t absolutes. And maybe the body of literature on them is more nuanced. It could be interesting to break out some different aspects on WHY there are differences. Especially considering too many zealots inject their faith-reliant beliefs into that why.
Speaking of how Europeans travel and looking into more, I’m curious what is happening in Spain with their Madrid – Barcelona HSR line. It opened before ultra-low-cost air carriers were a thing in the US let alone in Western Europe.
Ultra-low-cost air carriers like Vueling are getting pretty damn big… I mean, large and mature. How much of the Madrid-Barcelona market do they have these days? How much of the loss to train was due to measuring the peak of the air bridge in 2008? After all Spain’s economy took a nasty, nasty hit back then because of it.
These days it’s often cheaper to fly between Barcelona and Madrid than take the train. There’s some differences in there given different levels of service, last minute travel, et al.