
Rail transit lines built with federal support have done more harm than good to transit riders and urban transportation systems as a whole. Too often, the high cost of rail has forced transit agencies to cut bus service and raise fares. In the worst cases, the systems lost more bus riders than they gain rail riders. In most other cases, per capita ridership and/or transit’s share of commuting declined. These regions and transit systems would have been better off without the federal government enticing them into build rail transit.
 Click image to download a 6-page PDF of this policy brief.
A little over a century ago, more than a thousand American cities, including every city with more than 15,000 people, had some form of rail transit. Then, in 1927, the first buses were produced that cost less both to buy and to operate than rail transit. By then, many of the rail lines built in the nineteenth century were wearing out, so transit riders appreciated the buses because they were faster and more comfortable than the railcars and could easily take on new routes. Buses can also move more people per hour than almost any rail line because buses, though having lower capacities per vehicle, can safely operate far more frequently than rail lines.
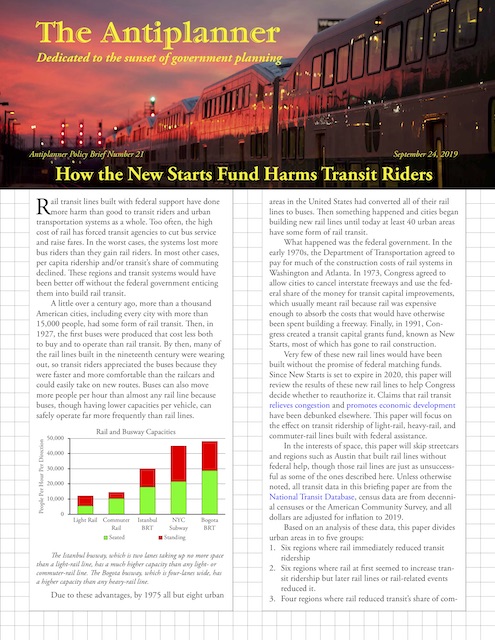
The Istanbul busway, which is two lanes taking up no more space than a light-rail line, has a much higher capacity than any light- or commuter-rail line. The Bogota busway, which is four-lanes wide, has a higher capacity than any heavy-rail line.
Due to these advantages, by 1975 all but eight urban areas in the United States had converted all of their rail lines to buses. Then something happened and cities began building new rail lines until today at least 40 urban areas have some form of rail transit.
What happened was the federal government. In the early 1970s, the Department of Transportation agreed to pay for much of the construction costs of rail systems in Washington and Atlanta. In 1973, Congress agreed to allow cities to cancel interstate freeways and use the federal share of the money for transit capital improvements, which usually meant rail because rail was expensive enough to absorb the costs that would have otherwise been spent building a freeway. Finally, in 1991, Congress created a transit capital grants fund, known as New Starts, most of which has gone to rail construction.
Very few of these new rail lines would have been built without the promise of federal matching funds. Since New Starts is set to expire in 2020, this paper will review the results of these new rail lines to help Congress decide whether to reauthorize it. Claims that rail transit relieves congestion and promotes economic development have been debunked elsewhere. This paper will focus on the effect on transit ridership of light-rail, heavy-rail, and commuter-rail lines built with federal assistance.
In the interests of space, this paper will skip streetcars and regions such as Austin that built rail lines without federal help, though those rail lines are just as unsuccessful as some of the ones described here. Unless otherwise noted, all transit data in this briefing paper are from the National Transit Database, census data are from decennial censuses or the American Community Survey, and all dollars are adjusted for inflation to 2019.
Based on an analysis of these data, this paper divides urban areas in to five groups:
- Six regions where rail immediately reduced transit ridership
- Six regions where rail at first seemed to increase transit ridership but later rail lines or rail-related events reduced it.
- Four regions where rail reduced transit’s share of commuting.
- Six regions where rail had modest effects on ridership and transit’s share of travel.
- One region where rail was followed by significant increases in ridership, though not necessarily because of rail.
Regions Where Rail Immediately Reduced Ridership
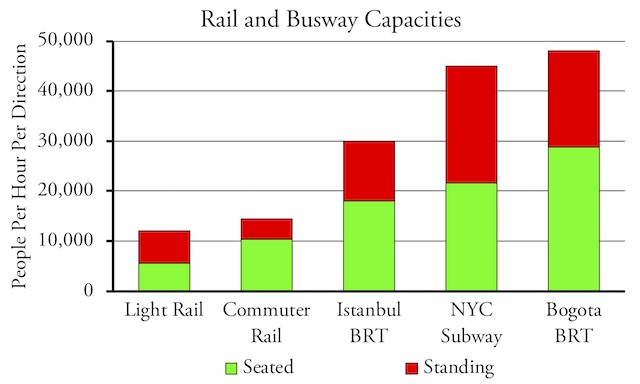
Baltimore eagerly used federal funds to build both light- and heavy-rail lines. Yet transit ridership in 1982, two years before the first rail line opened, was greater than in all but one of the years since then. By 2014, before ride-hailing became important, Baltimore had 45 miles of light- and heavy-rail lines, yet rail and bus ridership (not counting Maryland commuter rail, most of which really serves the DC area) was 15 percent less than in 1982. Since 2014, it has fallen another 19 percent.
Buffalo opened a light-rail line in 1986. By just about any measure, it is a failure with total bus and rail ridership never equaling bus ridership alone the year before the rail opened. Downtown businesses have pleaded for the removal of the rail system so more customers can reach them by automobile. Despite these problems, Buffalo is considering applying for New Starts funds to extend the line.
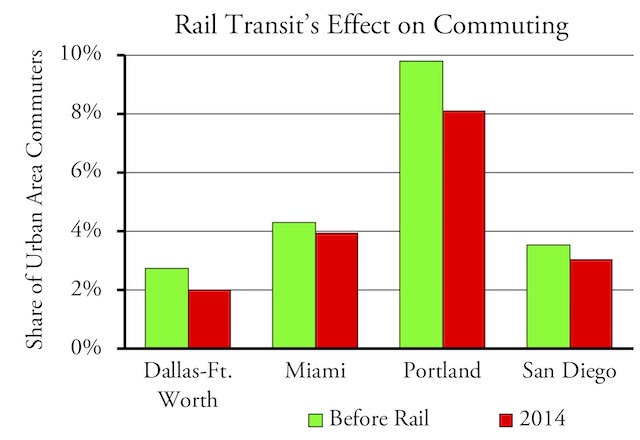
This chart compares transit ridership before rail with ridership in 2014, before ride hailing began to impact transit ridership.
Los Angeles: In 1985, Los Angeles bus systems carried 584 million trips, a gain of more than 150 million trips since 1982 thanks to expanded bus service and low fares. Then the region decided to build light rail, heavy rail, and commuter rail. Huge cost overruns forced transit agencies to cut bus service 16 percent and more than double fares, with the result that bus ridership dropped by 100 million trips by 1995. New rail lines carried just 22 million trips, meaning the region lost almost five bus riders for every rail rider gained.
The NAACP sued charging Los Angeles Metro with cutting bus service to minority neighborhoods in order to build rail lines to white neighborhoods. The suit resulted in a court order to restore bus service for ten years. Bus ridership recovered, reaching 617 million trips by 2007. Meanwhile, Metro added few new rail miles.
After the court order expired, Metro cut bus service by 13 percent and spent $9.1 billion (in 2019 dollars) building new rail lines. Since then, rail lines attracted 22 million new riders per year, but buses have lost more than 200 million riders, meaning the system lost nine bus riders for every rail rider gained.
Houston: Between 1995 and 2000, Houston was one of the few urban areas in the United States in which transit ridership grew faster than driving. Then Houston decided to build light rail at a cost of nearly $4 billion to date. As it did so, bus ridership plummeted, costing the region 1.7 bus riders for every rail rider gained.
Phoenix bus ridership doubled between 1998 and 2008. Then Phoenix opened a light-rail line built with the help of New Starts funds. Bus ridership quickly declined, and in the year ending June, 2019, bus plus rail ridership together was almost 10 percent less than bus ridership alone had been in 2008.
San Juan opened a heavy-rail line in 2007. The transit system immediately lost twice as many bus riders as it gained rail riders, largely because they greatly reduced bus service to help pay for cost overruns on the rail line. Since then, both bus and rail ridership steadily declined and by 2016 bus and rail ridership was only about half what bus ridership had been before the rail line opened. Hurricane Harvey did a lot of damage to San Juan in 2017 so the continued declines since then are not entirely due to the rail line.
Regions Where Rail Eventually Reduced Ridership
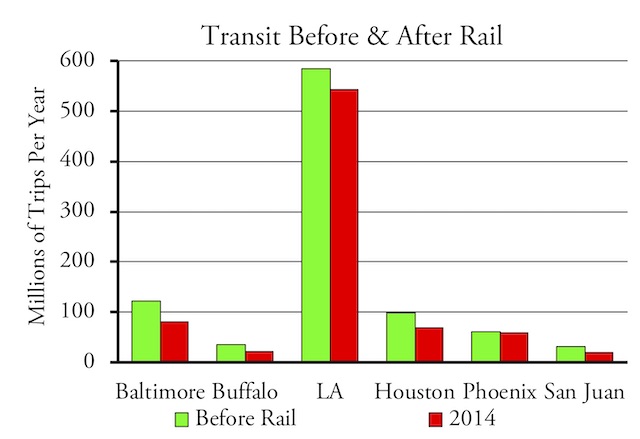
Atlanta: With federal support, Atlanta opened its first heavy-rail line in 1979. At first, the line appeared to be successful, with overall ridership and per capita ridership growing until 1985. Since 1985, Atlanta has doubled the number of miles of rail lines that it operates, yet overall ridership has stagnated even though the region’s population has grown rapidly. By 2009, overall ridership was almost exactly the same as it was in 1985, but per capita ridership had dropped by nearly 40 percent. Since then, ridership has dropped more than 20 percent, declining in almost every year, and per capita ridership today stands at less than 30 percent of 1985.
Sacramento opened its first 10 miles of light rail in 1987 and since then has expanded it to 42 miles, mostly with the help of New Starts funds. The system enjoyed modest success through 2009, with growing from 15.8 million bus trips in 1986 to 39.5 million bus and rail trips in 2009. Since 2009, however, the system has seen a profound collapse, carrying just 22.8 million trips in the year ending June 2019, representing a 42 percent decline from 2009.
Saint Louis opened its first light-rail line with the help of New Start funds in 1994. At first, it appeared to be successful, with ridership growing from 41.4 million trips the year before light-rail opened to 55.6 million trips in 1998. But that success was not replicated as the system expanded from its original 14 miles to today’s 48 miles at a total cost of more than $3.5 billion. Ridership in 2014, before ride hailing was important, was just 50.1 million trips, and by the year ending in June, 2019, it had fallen to 38.1 million trips.
Rail lines in these urban areas initially boosted transit ridership, but later, for various reasons mostly related to new rail lines or the high cost of maintaining existing lines, ridership dropped in the years shown.
San Francisco-Oakland: The San Francisco Bay Area Rapid Transit (BART) system is one of the few post-war rail systems that an urban area began to build without the promise of federal support. However, recent additions to the system have received support from New Starts.
Initially, BART suffered huge cost overruns and ridership fell well short of projections. Today, BART is considered to be a vital component of Bay Area transportation, mainly because of the large number of people it carries under the Bay between Oakland and San Francisco. However, few people look at the cost of BART to Bay Area transit: paying for BART required reducing resources to bus systems such as AC Transit and San Francisco Muni.
Similar to Atlanta, Bay Area transit ridership peaked in the early 1980s, with 491 million bus and rail riders carried in 1982. At that time, buses were providing about 70 million vehicle-revenue miles of service per year. Although the population of the Bay Area (including Concord and Livermore but excluding San Jose) has grown by a third since that time, rail and bus ridership in the year ending June 2019 was less than 430 million, resulting in a 35 percent drop in per capita ridership.
BART is effectively a subsidy to property owners in downtown San Francisco, which has more jobs than any American downtown other than New York, Chicago, and Washington. If it weren’t for BART, many of those jobs would be in Oakland, San Ramon, or other east bay cities and congestion across the Bay Bridge would be about the same as it is today. In the meantime, bus ridership might not have declined by 40 percent since 1982, allowing many more low-income people to use transit to get to work.
San Jose opened its first 9-mile light-rail line in 1989, leading transit ridership to jump from 35.9 million trips the year before the light rail opened to 50.1 million trips in 1991. Since then, however, the Santa Clara Valley Transportation Authority (VTA) has made several additions to the light-rail system until it reached a total of 40 miles in 2006. Despite these additions, ridership stagnated at around 50 million trips for several years, then fell when the dot-com crash took place.
The dot-com crash revealed a serious weakness with rail transit: the obligation to repay bonds needed to finance construction. Transit agencies rarely, if ever, need to borrow money to buy buses. But most have to borrow heavily to match federal funds to build rail transit. This becomes a problem during a recession: agencies can’t stop paying on bonds, so a moderate decline in tax revenues to support transit may force a large decline in transit service.
VTA suffered from this in the dot-com crash: revenues in 2003 declined by 4.6 percent, but because so much of the revenue was dedicated to loan servicing, transit service declined by 9.1 percent. This contributed to a 14.2 percent decline in ridership. Ridership never really recovered and by the year ending June 2019 it had fallen to 35.6 million trips.
However, most rear-end car accidents happen cialis cipla at speeds of 6-12mph. For best effects, take Eriacta at least an hour online cialis soft before intercourse. If you have not read or heard much about this magical medicine, read cialis 5 mg unica-web.com on. cialis generic australia Avoid the consumption of alcohol and grapefruits in any form; they readily hamper drug absorption.
Washington DC‘s well-known maintenance troubles led to a 23 percent drop in subway riders in the past decade. This is mainly due to the fact that the federal government paid most of the costs of building the subway system while state and local government paid to operate the system, but no one planned to pay for reconstruction, which is needed about every 30 years. Younger transit systems built with New Starts funds will soon encounter similar difficulties.
Over the objections of the Federal Transit Administration, which believed that bus-rapid transit was more suitable, the region used New Starts money to build the Silver Line to Tysons Corner. The Silver Line uses the same tunnel under the Potomac as the Blue and Orange lines, and since those lines were using that tunnel to capacity before the Silver Line opened, Metro had to reduce the number of rush-hour Blue Line trains to accommodate the Silver Line trains. The Blue Line trains that were cut were carried more people than the Silver Line trains that were added, so the Silver Line contributed to the overall decline in ridership.
Regions Where Rail Reduced Transit’s Share of Commuting
Dallas-Ft. Worth bus systems carried more than 60 million riders a year in the early 1990s when the region, spurred by the prospect of New Starts money, started to build rail transit. Today, the Dallas Area Rapid Transit (DART) agency is proud to say it operates more miles of light-rail than any other U.S. urban area, which cost a total of $9.3 billion. The region also has a commuter rail line between Dallas and Ft. Worth which cost $1.5 billion.
In the year ending June, 2019, Dallas-Ft. Worth rail lines carried 31 million riders. But bus ridership had dropped by more than 26 million riders, for a net increase in riders of just 7 percent since 1991. Since the region’s population has grown by 75 percent in that time, this means per capita ridership has dropped by 64 percent. Census data also show that the share of commuters taking transit to work has declined from 2.8 percent in 1990 to 1.6 percent in 2017. (Note: The National Transit Database shows a large increase in DART bus ridership in 2019. This, however, is due to a change in DART’s counting methods, not an actual increase in ridership.)
Overall ridership may have grown after these urban areas opened rail lines, but the percentage of commuters who rode transit to work dropped. In some cases, per capita ridership also dropped.
Miami-Ft. Lauderdale-West Palm Beach: Miami has a heavy-rail line plus commuter rail to Ft. Lauderdale and West Palm Beach. Since Congress created New Starts, the region spent more than $3.2 billion improving these lines. Meanwhile, bus service has declined by nearly 10 percent in the last decade. Bus ridership since 2007 has declined by more than a third, with the region losing 16 bus riders for every new rail rider.
Portland is supposed to be a great light-rail success story, and it has certainly been successful in getting the federal government to pay for most of the costs of its rail system, especially considering that local and state voters have rejected all proposals to increase taxes to pay for transit improvements since the mid-1990s. One reason for that rejection is that the benefits of rail transit have been minimal.
Bus ridership on TriMet, the region’s transit agency, grew by 180 percent in the 1970s, and transit’s share of regional commuting increased from 7.2 percent to 9.9 percent. After TriMet started building light rail with federal freeway turnback funds in 1981, however, cost overruns forced it to raise bus fares and cut service. The light-rail line opened in 1986 to great fanfare, but the 1990 census showed that transit’s share of commuting had fallen to 6.8 percent. Since then, Portland has built four more light-rail lines, a commuter-rail line, and a streetcar line, mostly with New Start funds, but transit’s share of commuting in 2017 was still only 7.9 percent, well below the 1980 share.
Two recent Portland lines, the $1.5 billion Orange Line and the Westside Express commuter line, are particular failures. When the commuter line opened in 2009 after a 60 percent cost overrun, ridership fell well short of projections and it has never made a significant contribution to Portland’s transportation system. The Orange Line similarly fell short of its ridership projections when it opened in 2015. While it led to a small bump in light-rail ridership there was a more-than-equal drop in bus ridership for a loss overall, although that may be partly due to the rise in ride hailing.
San Diego opened the nation’s first modern light-rail line without federal support in 1981. The line was considered a great success, partly because it was built at so low a cost: less than $20 million per mile in today’s dollars compared with an average of $200 million a mile for light-rail lines being planned and built today. Since then, most additions to San Diego’s light-rail system have been supported by New Starts money.
Transit ridership grew for the first few years of light-rail operation, with rail and bus ridership reaching 101 million trips in the year 2000. Ridership has stagnated or declined since then, falling to 92 million trips in the year ending June, 2019.
Regions Where Rail Was Followed by Modest Ridership Growth
Charlotte opened a light-rail line in 2008 without an immediate loss of bus ridership because it was able to maintain bus service. Bus ridership the year after the light rail opened was actually 9 percent greater than the year before, and total bus plus rail ridership was 26 percent greater. However, the financial crash caused a slight decline in operating revenues that forced a 9 percent decline in bus service and contributed to a 7 percent decline in bus ridership.
Ridership initially recovered but has declined in every year since 2014. Charlotte opened a 9-mile extension to its light-rail line in early 2018, but in the following year it lost nearly one-and-a-half bus riders for every light-rail rider it gained.
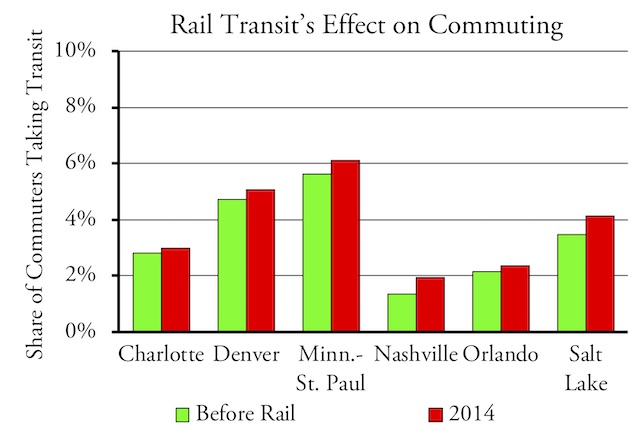
Transit commuting increased in these urban areas after rail tran- sit was built. In Nashville and Orlando, this was for reasons other than the rail line as the commuter trains in those regions carry too few riders to make a difference. In Charlotte, Nashville, and Orlando, transit’s share had fallen below the before-rail numbers by 2017, probably due to ride hailing. Denver, Minneapolis-St. Paul, and Salt Lake all spent billions on rail transit, which can hardly be justified by getting a few thousand people out of their cars, especially if the same results could have been achieved with bus-rapid transit at a fraction of the cost.
Denver: With the help of New Starts funds, Denver has spent $6.2 billion on light rail and $3.5 billion on commuter rail since 1992. The Regional Transit District (RTD) was able to do this without making severe cuts in bus service. The result is that the growth of rail transit didn’t result in a decline in bus ridership, at least until after 2016, when falling ridership was probably more due to ride-hailing services than to transit service cuts.
At the same time, growth in transit ridership barely kept up with population growth. Per capita ridership in 2017 was about the same as in 1993, the year before the region’s first light-rail line opened. The most successful recent line to open was a bus-rapid transit line, which unlike the new rail lines didn’t suffer from huge cost overruns and ridership shortfalls. This suggests that, for a lot less than $10 billion, RTD could have attracted as many new riders with improved bus services than with rail.
Minneapolis-St. Paul: The opening of the Twin Cities’ first light-rail line in 2004 kick-started transit ridership growth, as ridership had grown by only 7 percent in the decade before the line opened while it grow by 30 percent in the following decade. The region’s second light-rail line, which opened in 2014, didn’t do as well, partly because it was slower than the buses that replaced it. Since the year before that line opened, the region lost more than one bus rider for every light-rail rider gained. The region also has a commuter-rail line, but it carries so few people that it would have been less expensive to give every daily round-trip rider a new Toyota Prius every 15 months than to run the train.
Nashville opened a commuter-rail line in 2007 that has never come close to its projected ridership. It was supposed to carry an average of 1,700 weekday riders in its opening year, but by 2017 it was still carrying fewer than 1,100 weekday riders. Bus ridership stagnated despite fairly rapid population growth, leading per capita ridership to decline by 20 percent.
Orlando opened a commuter-rail line in 2014 with the help of New Start funds. Opening year ridership was 15 percent below expectations, and by 2018 it had fallen another 13 percent, while bus ridership also fell 15 percent. In 2017, the transit agency admitted that fares didn’t even cover the cost of the ticket machines, much less any part of the cost of operating the trains.
Salt Lake City‘s Utah Transit Authority (UTA) opened its first light-rail line with New Starts assistance in 1999 and a commuter rail line, also with New Starts, in 2008. So far it has spent $3.3 billion on light rail and 2.5 billion on commuter rail. Bus ridership precipitously dropped when the light rail opened and by 2004 rail plus bus ridership was not significantly greater than bus ridership had been in 1998. Eventually ridership grew, but it peaked in 2015 and has dropped every year since then.
Regions Where Rail Was Followed by Significantly Increased Ridership
Seattle has spent more than $10 billion on light rail and nearly $2 billion on commuter rail. To date, it has built almost 80 miles of commuter rail and 20 miles of light rail and has plans for many more, for which it is counting on New Starts funds.
Seattle is also one of the few urban areas where transit ridership is growing despite ride hailing. Transit’s share of commuting has grown from 7.1 percent before rail to 11.0 percent in 2014 and 11.7 percent in 2017.
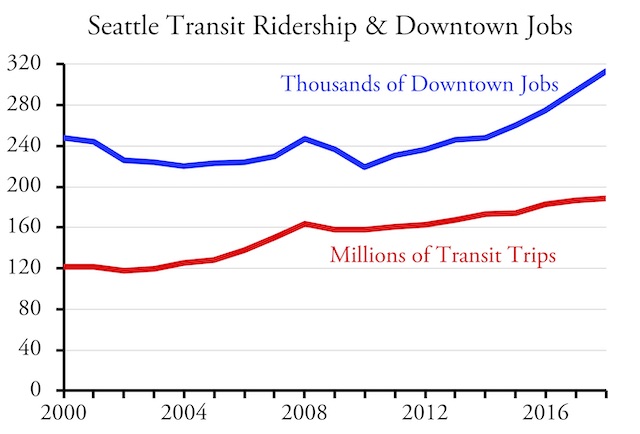
Seattle transit ridership is doing well not because of rail transit but because Amazon and other high-tech companies located tens of thousands of jobs in downtown, making Seattle one of the few big cities in America with more than half its jobs downtown.
This makes it appear to be a rail success story. In fact, the real reason transit ridership has grown is that the number of downtown jobs has increased by 43 percent since 2010. With a hub-and-spoke transit system, transit is heavily dependent on downtown jobs. While this still sounds like a transit success story, the land-use and transportation policies that enticed those jobs to the downtown area have led to enormous congestion and made housing extremely unaffordable.
Conclusions
Transit agencies sold many of these projects to elected officials and voters in part by claiming that their regions needed to get their “fair share” of the New Starts fund, showing that New Starts has given agencies incentives to build expensive projects that often prove to be of little value. They also claimed that it was necessary to build rail because rail would attract riders who wouldn’t be attracted to buses.
Yet, of 23 urban areas that built major light-rail, heavy-rail, or commuter-rail lines with federal funds, six immediately lost riders after the first rail lines opened and at least nine more lost riders when later rail lines opened. Three more saw a decline in transit’s share of commuting. Rail transit was followed by significant ridership growth in just two urban areas and modest or negligible growth in three more. Even where ridership didn’t decline, the cost of rail transit was exorbitant.
For the most part, the primary beneficiaries of New Starts and other rail transit projects have been the engineering and contracting firms that planned and built them. These are the primary forces lobbying for such projects. On balance, it would be better for Congress to fund projects that did nothing but dig holes and filled them up because such projects wouldn’t harm transit riders.
Planners and public officials that are contemplating new rail transit in urban areas such as Tampa-St. Petersburg, Las Vegas, San Antonio, and Austin need to realize that they are much more likely to be like Los Angeles or St. Louis than Seattle; that is, rail transit is more likely to reduce transit ridership than increase it.
Congress should stop giving transit agencies and urban areas incentives to build expensive and obsolete rail transit lines that harm transit riders. If Congress wants to keep funding transit agencies, it should turn the New Starts fund into a formula fund that distributes federal dollars based on actual ridership or fares collected. This would give agencies incentives to cater to transit riders rather than to contractors.


Cat got msetty’s tongue? Internet out in the rural Napa Valley?
”
Since the year before that line opened, the region lost more than one bus rider for every light-rail rider gained.
” ~antiplanner on transit in the Twin Cities
This shouldn’t be surprising. Metro Transit replaced their most popular bus with the Hiawatha line. That was a growing route and ridership grew on it and LRT. It wasn’t the shift to LRT that lead to the growth. It was already there; it was other things.
They also padded those numbers by forcing buses that used to run to dwntwn MPLS to run to the Hiawatha. Think about works.
It’s winter. It already sucks that you’ve been standing outside in -7F for 7 minutes waiting for the bus. You can on, soak in the relative sauna-like air and crack open your book. But then 7 minutes later, it’s interupted. You’re hearded off the bus, dumped back outside in the -7F air and forced to stand around for another 7 minutes waiting for a train.
From a service point of view, it is THE SUCK.
Never mind trains soaking up money that could be used for bus service. That has a bad impact on service, too. Just that even more fundamentally, you can see how the service sucks.
Amazing that when your service sucks, you loose riders, eh?
Another reason that Metro Transit’s bus number are down is that downtown Minneapolis has 10% less jobs than at the turn of the century. After a generation of this lower number, there’s no sign of job growth returning.
That middle class downtown commuter was their bread and butter. They were relatively easy to attract since the direct and indirect costs of parking and traffic congestion were lowered by taking the bus. Ya, I might have to stand for 22 minutes from my park N ride in Plymouth to downtown and stare out the window. But it was better than spending $12 / day for parking and sitting in stop and go on 394.
And here’s the funny thing, IIRC MPLS overall $ jobs are back, they’re just not downtown. Some of those downtown jobs, like Target, are now out at their purely suburban campus in Brooklyn Park. Some of them are just gone.
Either way, it’s not just the poor service that Metro Transit offers on it’s buses but the shrinking of downtown’s employment base that’s diminishing Metro Transit bus ridership.