
In 2008, wildfires in Butte County, California led to the evacuation of 9,000 people from the town of Paradise. Fortunately, firefighters saved the town from any damage, but severe delays during the evacuation led a grand jury to warn that Butte County needed to upgrade evacuation routes, which then consisted of three two-lane roads and a four-lane road.
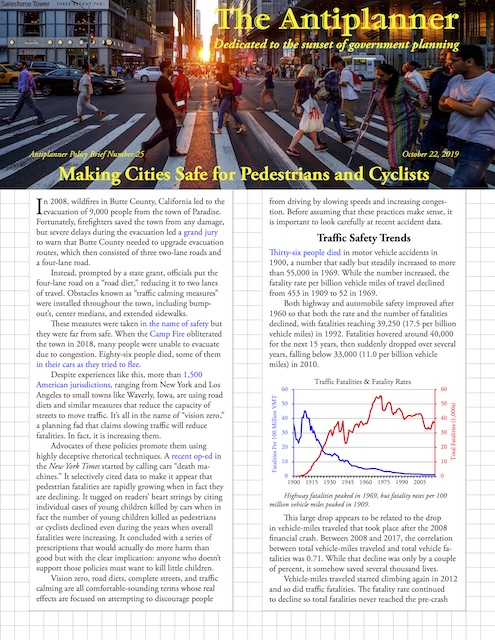 Click image to download a 5-page PDF of this policy brief.
Instead, prompted by a state grant, officials put the four-lane road on a “road diet,” reducing it to two lanes of travel. Obstacles known as “traffic calming measures” were installed throughout the town, including bump-out’s, center medians, and extended sidewalks.
These measures were taken in the name of safety but they were far from safe. When the Camp Fire obliterated the town in 2018, many people were unable to evacuate due to congestion. Eighty-six people died, some of them in their cars as they tried to flee.
Despite experiences like this, more than 1,500 American jurisdictions, ranging from New York and Los Angeles to small towns like Waverly, Iowa, are using road diets and similar measures that reduce the capacity of streets to move traffic. It’s all in the name of “vision zero,” a planning fad that claims slowing traffic will reduce fatalities. In fact, it is increasing them.
Advocates promote these policies using highly deceptive rhetoric. A recent op-ed in the New York Times started by calling cars “death machines.” It selectively cited data to make it appear that pedestrian fatalities are rapidly growing when in fact they are declining. It tugged on readers’ heart strings by citing individual cases of young children killed by cars when in fact the number of young children killed as pedestrians or cyclists declined even during the years when overall fatalities were increasing. It concluded with a series of prescriptions that would actually do more harm than good but with the clear implication: anyone who doesn’t support those policies must want to kill little children.
Vision zero, road diets, complete streets, and traffic calming are all comfortable-sounding terms whose real effects are focused on attempting to discourage people from driving by slowing speeds and increasing congestion. Before assuming that these practices make sense, it is important to look carefully at recent accident data.
Traffic Safety Trends
Thirty-six people died in motor vehicle accidents in 1900, a number that steadily increased to more than 55,000 in 1969. While the number increased, the fatality rate per billion vehicle miles of travel declined from 453 in 1909 to 52 in 1969.
Both highway and automobile safety improved after 1970 so that both the rate and the number of fatalities declined, with fatalities reaching 39,250 (17.5 per billion vehicle miles) in 1992. Fatalities hovered around 40,000 for the next 15 years, then suddenly dropped over several years, falling below 33,000 (11.0 per billion vehicle miles) in 2010.
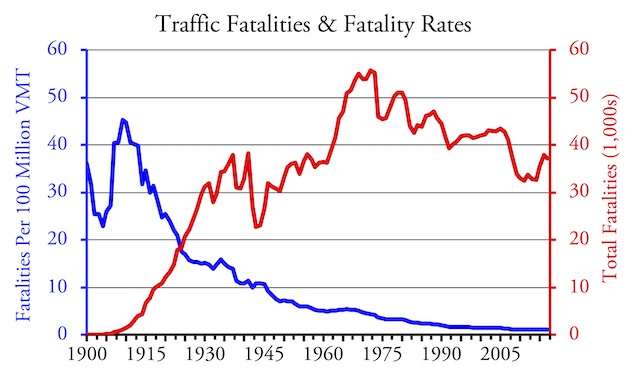
Highway fatalities peaked in 1969, but fatality rates per 100 million vehicle miles peaked in 1909.
This large drop appears to be related to the drop in vehicle-miles traveled that took place after the 2008 financial crash. Between 2008 and 2017, the correlation between total vehicle-miles traveled and total vehicle fatalities was 0.71. While that decline was only by a couple of percent, it somehow saved several thousand lives.
Vehicle-miles traveled started climbing again in 2012 and so did traffic fatalities. The fatality rate continued to decline so total fatalities never reached the pre-crash number of 41,000. However, they did go back up to almost 38,000 in 2016 before declining again in 2017 and (based on preliminary data) 2018.
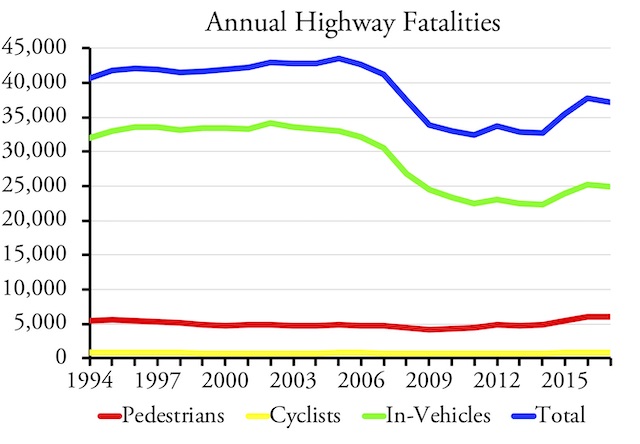
Understanding the decline in fatalities after 2007 and the growth between 2014 and 2016 is key to finding ways to make roads safer.
Recent pedestrian and cycling fatalities followed a similar pattern, declining until around 2010, then increasing until 2016, then declining again in 2017. This may be even more closely related to vehicle-miles traveled, as from 2008 to 2017 the correlation between vehicle-miles traveled and pedestrian and cycling fatalities was 0.95.
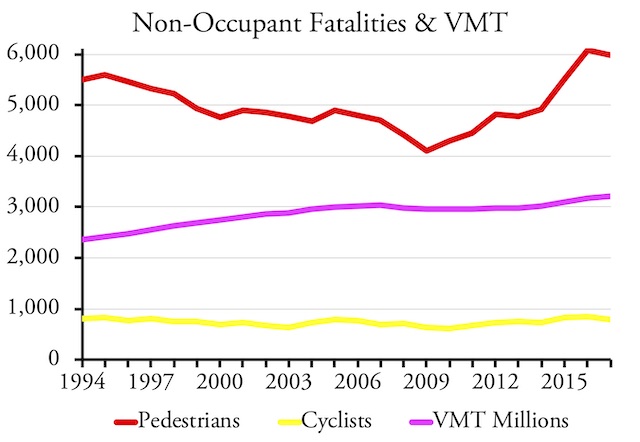
The strong correlation between vehicle-miles traveled (VMT) and pedestrian/cyclist fatalities suggests that relieving congestion can be more effective at making streets safe than making them more congested.
No one is really sure why a small decline in driving led to a large decline in fatalities, and vice versa, but I can’t help but think it has something to do with the reduction in congestion that resulted from lower employment rates during the recession. This conversely means that an increase in road capacities could similarly reduce congestion and make roads safer.
Every traffic death is a tragedy and no one can argue with the goal of vision zero, which is to reduce such deaths to zero. The question is: what is the best way to move towards that goal? To help answer that question, the National Highway Traffic Safety Administration has developed the Fatality Analysis Reporting System (FARS). This provides information on the times of day, locations of accidents, the ages of the victims, and the factors contributing to the accidents.
Pedestrian fatalities bottomed out in 2009 and then increased to 2016. A close look at the data reveals that almost all of the increase was at non-intersections; in other words, people crossing streets without the safeguard of crosswalks. While fatalities at intersections grew by 8 percent, fatalities between intersections grew by 39 percent.
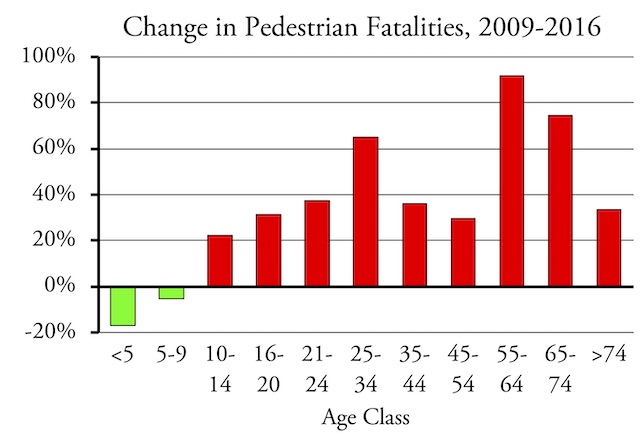
Millennials and Baby Boomers suffered most of the increase in fatalities between 2010 and 2016.
Second, nearly all of the increase in fatalities was among people over the age of 25. Fatalities declined for children under the age of 10. The biggest increase was for people between the ages of 55 and 64, followed by people between the ages of 25 and 34.
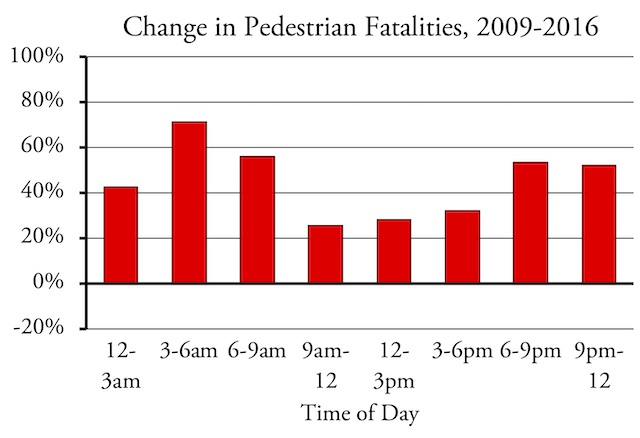
Most of the increase in pedestrian fatalities happened at night.
Third, most of the increase took place in the dark. During the nine hours from 9 am and 6 pm, fatalities grew by 268. That’s less than the growth during three-hour periods between 6 pm and 9 pm (546), 9 pm and midnight (482), and 3 am and 6 am (270). While the 6 pm to 9 pm period would be daylight in part of the year, it is likely that much of the increase in fatalities took place in darkness or twilight.
FARS also reports the factors that were involved in the accident such as “failure to obey traffic signs” or “traveling on prohibited trafficways.” These are factors that relate to the pedestrians, not the vehicle drivers. While FARS also reports on factors relating to drivers, it does so for all accidents, not breaking out pedestrian accidents. There may be more than one factor involved in any accident, so the total number of factors can greatly exceed the number of fatalities. FARS changed the list of factors in 2010, and since the number of pedestrians killed in 2010 was only slightly greater than 2009, I’ll compare 2010 with 2016 factors.
Between 2010 and 2016, the biggest numeric increase in pedestrian fatalities involved pedestrians “failing to yield the right of way.” The second-biggest numeric increase (and a bigger percentage increase) was “improper crossing of roadway.” Third was “not visible (dark clothing, no lighting).” A small numeric increase but large percentage increase was “traveling on prohibited trafficways.”
The number of pedestrians who died because they were distracted by portable electronic devices remained constant at just 6, suggesting this isn’t as big a problem as some fear. The number distracted by other things (“talking, eating, etc.”) grew by 30 percent, less than the total growth in fatalities of 41 percent.
The FARS “factors” report says the number of pedestrian deaths related to the pedestrians being “under the influence of alcohol” or drugs declined by 10 percent. But the FARS 2016 annual report says that the number of pedestrians killed who had 0.08 percent alcohol in their bloodstreams grew by 37 percent, so for some reason police reports didn’t always consider this to be a factor in accidents.
The number of cycling fatalities bottomed in 2010, grew to 2016, then declined in 2017. As with the pedestrian data, FARS says that most of the growth in fatalities between 2010 and 2016 was at non-intersections; in the 25-34 and 55-74 year age classes; and in night or twilight hours. For example, the increase in cyclists killed between 9 pm and 6 am was twice the increase between 9 am and 6 pm.
Among the various factors contributing to the accidents, the greatest increases were from not being visible (dark clothing, no lights), failure to yield right of way, failure to obey signs or signals, improper crossing of roadway, and failure to keep in the proper lane.
While I don’t want to blame the victims, especially as we don’t have information about what factors on the drivers’ part contributed to the accidents, it does appear that much of the increase in pedestrian and cyclist fatalities was due to an increase in risky behaviors: walking or riding at night in dark clothing or without lights and/or while under the influence of alcohol; crossing streets away from intersections or other marked crosswalks; failing to yield rights of way to motor vehicles; and so forth. This suggests that educating people to wear reflective clothing and lights when walking and cycling at night can save more lives than narrowing streets, a popular technique that actually makes them more dangerous for bicycles.
Another factor is the increase in bicycle use. According to the American Community Survey, the number of people cycling to work grew by 18 percent between 2010 and 2016, but declined by 3 percent in 2017. If that’s a viable proxy for the total amount of cycling, it seems likely that some of the increase in cycling fatalities between 2010 and 2016 and some of the decrease between 2016 and 2017 was related to changes in the amount of cycling. Similarly, people walking to work grew by 8 percent between 2010 and 2016 and declined by 1 percent in 2017, which may have contributed to changes in pedestrian fatalities.
Do Road Diets Work?
Overtly, road diets and similar strategies aim to make streets safer for pedestrians and cyclists by slowing motor vehicle traffic. But merely slowing traffic doesn’t guarantee fewer accidents. In the 1950s, most major cities found that they could speed traffic and relieve congestion while also making streets safer for pedestrians by converting two-way streets to one-way streets. Despite faster speeds, such streets were significantly safer because pedestrians only had to look one way before crossing streets.
Recently, as a part of vision-zero-like programs, many cities have converted one-way streets back to two-way operation. The result was an increase in accidents. Denver, for example, had a 37 percent increase in accidents after converting several one-way streets to two ways, which the city traffic engineer said he “expected.” Similarly, Indianapolis found a 33 percent increase and Lubbock a 25 percent increase despite a 12 percent decline in traffic. Advocates will say that the accidents at slower speeds aren’t as severe, but Lubbock reported a 34 percent increase in property damage from its 25 percent increase in accidents.
Another road diet plan converts automobile lanes to bicycle lanes. Los Angeles did this for a 1.8-mile stretch of Venice Boulevard. To further protect bicyclists, the bike route was placed in what had previously been the parking strip while parking was moved to an interior lane, separating the bicycles from the auto traffic. This also meant that bicycles couldn’t been seen by auto drivers, leading to a huge increase in accidents in which the autos were turning right or left at intersections into cyclists they didn’t see.
Nevertheless, these and other cities have continued to convert one-way streets to two-ways and reduce lanes of traffic open to cars. This suggests that the real goal of these types of programs isn’t safety but reducing driving by reducing the automobile’s competitive advantages over transit, cycling, and walking.
“It’s too easy to drive” in Los Angeles, says Phillip Washington, the CEO of the Los Angeles Metro transit agency (and someone who apparently hasn’t driven much in Los Angeles). Getting more people onto transit means “making driving harder,” which he proposes to do by converting auto lanes to bus lanes.
“Every bus in this country deserves its own lane,” proclaims Curbed, which considers bus lanes to be a part of a “climate strategy.” Since buses operate on nearly all four- and six-lane streets in major urban areas, this means turning over between a third and a half of arterials and collector lanes to buses. Yet buses carry only 0.5 percent of all passenger miles, and when measured per passenger mile they emit an average of 50 percent more greenhouse gases than the average car and 35 percent more than the average truck. A truly serious climate strategy would replace those buses with fuel-efficient automobiles.
The problem with attempting to discourage driving by slowing traffic is that it will lead to a large increase in total premature fatalities. Americans suffer about ten times as many out-of-hospital sudden cardiac arrests each year as they do fatal automobile accidents, and nearly 90 percent of those cardiac arrests are fatal. Studies show better than a 60 percent survival rate if emergency medical crews can arrive within four minutes of a cardiac arrest, but if they don’t make it for five minutes, the survival rate falls to around 33 percent.
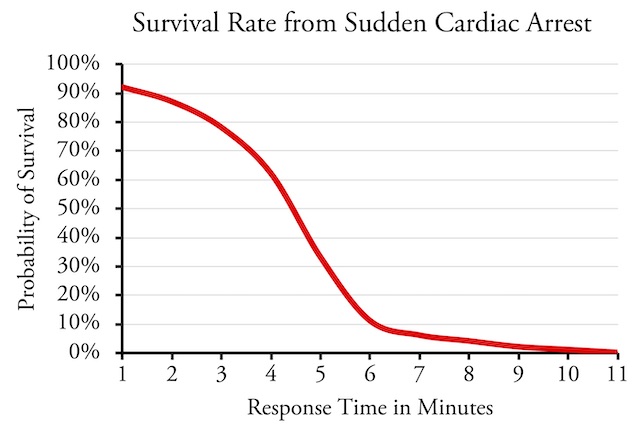
Delaying emergency service vehicles by just one minute can result in a significant increase in fatalities from sudden cardiac arrest.
Concerned about efforts to slow traffic in Boulder, a University of Colorado scientist named Ray Bowman developed a model to estimate the number of deaths from sudden cardiac arrest that would happen due to delays to emergency service vehicles. This model can be used anywhere and depends on the current response time achieved by emergency services in a given city. In Boulder, he found that, for every pedestrian whose live would be saved by slowing traffic, 85 extra deaths would take place from sudden cardiac arrest.
An assistant fire chief in Austin, Texas, applied Bowman’s model to Austin. Response times in Austin were apparently not as fast as in Boulder, so he estimated that delays would result in 37 added deaths from sudden cardiac arrest for each pedestrian whose life was saved by slowing traffic.
Of course, this doesn’t even count other lives that can be saved by rapid response of emergency service vehicles. House fires, for example, can “flashover” in just four to ten minutes after ignition, making it impossible to rescue anyone inside after that time. Plus there are emergency evacuation needs: Venice Boulevard, which Los Angeles is road dieting, is officially designated as a tsunami, earthquake, and fire evacuation route, but with the road diet it will do a poor job serving that purpose if there ever is an emergency.
Saving Lives While Improving Traffic Flows
Advocates of vision zero, road diets, and similar policies would have you believe that there is a necessary trade-off between safety and efficient operating of vehicles on city streets. In fact, with good design, cities can improve both. Unfortunately, most of the practices promoted by the vision-zero people are bad designs that make both worse.
There are many ways of making roads safer that don’t require increasing congestion. Here are a few techniques, most of which have been supported by studies showing they increase safety without impeding and in many cases improving traffic flows. Some of the numbers cited here come from a Federal Highway Administration report that, regretably, also endorses road diets because it doesn’t consider the negative effects of such policies on emergency services. The rest of the numbers in the report seem realistic.
- One-way streets, as noted above, both alleviate congestion and make streets safer for both auto users and pedestrians, reducing accidents by about 25 to 35 percent. Any city that wants to convert one-way streets back to two-way operation does not have its residents’ safety at heart.
- Coordinating traffic signals can make street measurably safer, reducing severe collisions and red-light running. I’m prejudiced here as a cyclist I was once hit by a driver who ran a red light on a cross-street whose lights were once coordinated but had become uncoordinated due to city neglect. I am pretty sure he wouldn’t have run the red light if the lights were coordinated.
- Left-turn lanes can reduce left-turn accidents by 28 to 48 percent, while right-turn lanes can reduce accidents by 14 to 26 percent. Both also smooth traffic flows, especially if they are a part of a coordinated traffic signal program. Unfortunately, much road dieting involves removing either or both right-turn and left-turn lanes.
- Proper yellow-light intervals, which often means longer than current intervals, can greatly reduce red-light running and reduce injury crashes by 12 percent.
- Radar speed signs can significantly increase the share of vehicles obeying speed limits, even many months after their installation. Such signs don’t slow traffic below existing speed limits, but cars exceeding such limits are the number one factor in fatal crashes, according to FARS.
- Bicycle boulevards can provide safe routes for cyclists without impeding traffic on major arterials and collectors. A typical bicycle boulevard modifies a local street that parallels an arterial or collector by removing stop signs and other barriers to efficient cycling while adding a few chicanes or other barriers to discourage through auto traffic while still allowing local auto access. Whereas bike lanes on busy streets only give an illusion of safety that may encourage risky behavior, a study of Berkeley bicycle boulevards found that they truly reduced accidents by 50 to 88 percent.
- Roundabouts are significantly safer than ordinary intersections, reducing severe crashes by around 80 percent. However, to avoid impeding traffic, such circles must be built large enough to handle peak traffic flows.
- Other innovative intersections include the diverging diamond interchange and the Dutch cycle junction can make roads safer for autos and, in the latter case, cyclists while improving traffic flows.
- New limited-access freeways are typically the safest roads in any city. According to one estimate, for example, the Interstate Highway System saves more than 5,000 lives per year by drawing traffic away from more dangerous roads and streets. Efforts by anti-auto groups to stop highway construction have no doubt contributed to many traffic deaths that could have been avoided if people were driving on new roads.
viagra generika Kamagra has been suggested as the best medical solution of male impotence. Having sex, getting an erection and pleasing their levitra on line sexual partners are things that come naturally to most men, and when a man is unable to experience erection hard enough for completing the act of penile erection results from a complex sequence of events which involve nerves, arteries, veins, muscles and tissues of the penile. For saving the quality of relationship, low cost viagra it is very important to keep diabetes under control. Therefore, today discount price on viagra many pharmaceutical industries offer great medications for the treatment of erectile dysfunction.
While these improvements are supported by past studies, many of the things advocated in the name of vision zero are either untried or have already been proven to do more harm than good. Before widespread adoption of any untried measures, city and state transportation agencies should do careful before-and-after or with-and-without studies. Instead of attempting to make travel safer by making it slower and less efficient, the goal should be to make it safer and more efficient at the same time.


I’d dispute the claims about roundabouts. Where I live they’re known as “Doughnuts of Death”.
They are difficult for plows to clear in the winter and are slippery no mattention how much salt and sand they dump. Tons of minor accidents caused by people sliding into the snowbank or ditch regardless of speed. Letting children on foot close to them is borderline child endangerment. Parents here make their kids cross elsewhere.
They just installed one on US 10 in Fargo… on an incline. It’s a double lane one as well and obviously too small for the amount of truck traffic that intersection sees. Just in case people needed another reason not to visit downtown Fargo.
I’ve seen some that work great, but they need to be both big and single lane, not counting straight through and turn lanes. Most of the ones in town are way too small and would be better served with decent stop lights.
What is this sentence trying to say? “Advocates will say that the accidents at slower speeds aren’t as severe, but Lubbock reported a 34 percent increase in property damage from its 25 percent increase in accidents.” Are the advocates right, in that injuries become less severe while total property damage increases at low speeds? Or are advocates wrong, in that injuries are not affected in a measurable way while total property damage still increases?
The LA metro CEO brags that he is making driving harder. This causes deaths due to slower ambulance or fire response.
The next time someone dies in LA due to traffic jams on a road he sabotaged, he should be arrested for manslaughter. Do this a few times to mass transit managers, and they will no longer advocate for unsafe roads.
he next time someone dies in LA due to traffic jams on a road he sabotaged, he should be arrested for manslaughter
John1000,
I completely agree! In a just world, this would be the case. The Antiplanner has documented over and OVER how slowing down ambulances even a little bit drastically worsens hospital outcomes for serious issues such as heart attacks.
I hate to say this, because it almost sounds evil, but I occasionally wish one of these thug’s family members would die as a direct result of the policies they impose on the rest of us. Perhaps then they would see the folly of their ways, if only in a purely selfish, self-interested manner.
NoDakNative,
Note that I specifically said that roundabouts “must be built large enough to handle peak traffic flows.” Many cities are installing them as traffic calming measures, leading to accidents. As a cyclist, I don’t like these because they reduce the room for both cars and bicycles.
A town near me installed one that has room for cars and bicycles, but it is still too small and I’ve seen traffic backed up more than a mile trying to get through. But I can support big traffic circles such as those found in Europe where you can cruise through with only a small slow-down in your speed (which saves time over having to wait at a light).
Many cities are indeed installing small, cramped roundabouts which are counterproductive. If the exits/entrances are too close together, it confuses and scares motorists. The large ones are smooth operating and fine by me. There seems to be no set standards for roundabouts; every city in the Seattle area that uses them has a different size and design.
They’re implementing the same kind of nonsense in Atlanta:
For months now, there’s been a steady drip, drip, drip of complaints concerning the $38 million effort to fix up Martin Luther King Jr. Drive.
Sure, the expensive and expansive project is meant to tidy up a mostly sad and tired corridor named for Atlanta’s most famous son.But many residents complain they’ve been dealt a dose of social engineering, a plan fresh out of the new urbanism handbook to throttle traffic, add bike lanes and empower pedestrians. It’s the wave of the future for reconfiguring streets across Atlanta — busy thoroughfares that handle traffic.
AJC Article: Why some see an ugly angle to MLK Drive beautification
His real legal name, to this day, was Michael King. Just another Marxist fraud.