
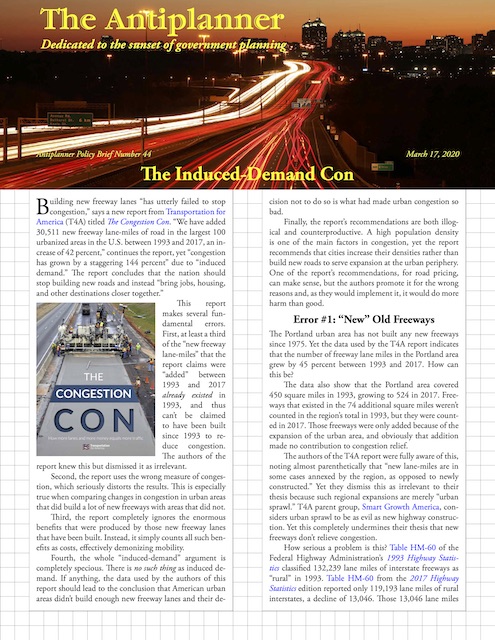
Building new freeway lanes “has utterly failed to stop congestion,” says a new report from Transportation for America (T4A) titled The Congestion Con. “We have added 30,511 new freeway lane-miles of road in the largest 100 urbanized areas in the U.S. between 1993 and 2017, an increase of 42 percent,” continues the report, yet “congestion has grown by a staggering 144 percent” due to “induced demand.” The report concludes that the nation should stop building new roads and instead “bring jobs, housing, and other destinations closer together.”
 Click image to download a four-page PDF of this brief.
This report makes several fundamental errors. First, at least a third of the “new freeway lane-miles” that the report claims were “added” between 1993 and 2017 already existed in 1993, and thus can’t be claimed to have been built since 1993 to reduce congestion. The authors of the report knew this but dismissed it as irrelevant.
 Click image to download a PDF of this report.
Second, the report uses the wrong measure of congestion, which seriously distorts the results. This is especially true when comparing changes in congestion in urban areas that did build a lot of new freeways with areas that did not.
Third, the report completely ignores the enormous benefits that were produced by those new freeway lanes that have been built. Instead, it simply counts all such benefits as costs, effectively demonizing mobility.
Fourth, the whole “induced-demand” argument is completely specious. There is no such thing as induced demand. If anything, the data used by the authors of this report should lead to the conclusion that American urban areas didn’t build enough new freeway lanes and their decision not to do so is what had made urban congestion so bad.
Finally, the report’s recommendations are both illogical and counterproductive. A high population density is one of the main factors in congestion, yet the report recommends that cities increase their densities rather than build new roads to serve expansion at the urban periphery. One of the report’s recommendations, for road pricing, can make sense, but the authors promote it for the wrong reasons and, as they would implement it, it would do more harm than good.
Error #1: “New” Freeways That Already Existed
The Portland urban area has not built any new freeways since 1975. Yet the data used by the T4A report indicates that the number of freeway lane miles in the Portland area grew by 45 percent between 1993 and 2017. How can this be?
The data also show that the Portland area covered 450 square miles in 1993, growing to 524 in 2017. Freeways that existed in the 74 additional square miles weren’t counted in the region’s total in 1993, but they were counted in 2017. Those freeways were only added because of the expansion of the urban area, and obviously that addition made no contribution to congestion relief.
The authors of the T4A report were fully aware of this, noting almost parenthetically that “new lane-miles are in some cases annexed by the region, as opposed to newly constructed.” Yet they dismiss this as irrelevant to their thesis because such regional expansions are merely “urban sprawl.” T4A parent group, Smart Growth America, considers urban sprawl to be as evil as new highway construction. Yet this completely undermines their thesis that new freeways don’t relieve congestion.
How serious a problem is this? Table HM-60 of the Federal Highway Administration’s 1993 Highway Statistics classified 132,239 lane miles of interstate freeways as “rural” in 1993. Table HM-60 from the 2017 Highway Statistics edition reported only 119,193 lane miles of rural interstates, a decline of 13,046. Those 13,046 lane miles didn’t disappear into thin air; they were reclassified as “urban” as urban areas naturally expanded.
The 2017 table also showed 25,000 of non-interstate freeway lane-miles in rural areas, while the 1993 report didn’t separately identify non-interstate freeways. If the same proportion of such freeways were added to urban areas in the intervening years, then a total of 15,800 urban lane miles in 2017 already existed in 1993. Some of these were outside of the 100 urban areas considered in the T4A report, but those 100 urban areas contained 72 percent of all urban freeway lane-miles in the country in 2017. Thus, it is likely that at least 11,400 lane-miles, well over a third of the 30,511 that T4A implies were built in that time period, already existed in 1993.
Urban area boundaries are neither political nor economic lines but are determined demographically by the Census Bureau after each decennial census based on such criteria as population densities and development. The 1990 census found that the 100 urban areas considered in the T4A report covered about 42,000 square miles of land. The 2010 census found that they had grown to 57,400 square miles, an increase of 36.5 percent. This growth accommodated an 87 percent increase in population between 1993 and 2017.
In a larger sense, however, these urban areas didn’t really grow but merely densified. The land that was outside the 1990 boundaries but inside the 2010 boundaries still had residents, industry, and other developments in 1990. The roads that were outside the 1990 boundaries but inside the 2010 boundaries served those residents, industries, and other developments, many of which located to those areas to escape urban congestion. In order to support its thesis that new roads don’t relieve congestion, T4A pretends that these 11,400 or more freeway lane-miles didn’t exist in 1993, when clearly they did.
The T4A report also errs in claiming that the 100 urban areas in the report only grew in population by 32 percent between 1993 and 2017. This ignores the fact that, between those two years, the Census Bureau divided up many major urban areas into smaller areas. Concord, Livermore, and Vallejo were split from the San Francisco urban area. Murrietta and Santa Clarita were split from the Los Angeles urban area. The 32 percent number is the percentage I calculate only if I don’t account for these splits. The resulting error is not as big as the error in lane miles, but it shows that T4A is careless in how it accounts for data.
Error #2: The Wrong Measure of Congestion
To measure changes in congestion between 1993 and 2017, T4A uses the Texas Transportation Institute’s urban mobility report, which calculates congestion in 100 urban areas between 1982 and 2017. T4A’s analysis begins in 1993 because some of the data it wanted to use were not available for the years 1982 through 1992.
The specific congestion measure used by T4A was the percentage change in the hours of delay per commuter between 1993 and 2017. Yet this is completely the wrong measure to use for several reasons.
First, the percentage change biases the analysis against urban areas that have deliberately tried to minimize congestion. To use an extreme example, Bakersfield had 5 hours in per-commuter delay in 1993 growing to 24 in 2017, a 380 percent increase. Los Angeles had 73 hours in 1993 growing to 119 in 2017, a 63 percent increase. The 46 hours of increased delay in Los Angeles is clearly much worse than the 19 hours in Bakersfield, but because T4A used percentage growth, Bakersfield looks much worse than Los Angeles.
A second problem is that the Texas Transportation Institute data counts congestion on all roads, while the T4A report only looks at the growth of freeways. On one hand, a region can do a lot to relieve congestion without building new freeways, either by building new arterials or by adding traffic signal coordination and other improvements to non-freeways. On the other hand, a region can build a lot of freeways but still experience a lot of congestion growth on non-freeways if it doesn’t make improvements to its non-freeway infrastructure. Thus, the measure of congestion on all roads may have no relationship to new freeway construction.
A third problem is that the Texas Transportation Institute’s early estimates of congestion were based on calculations in a computer model, not on actual on-the-ground measurements of congestion. It isn’t clear that these numbers are completely reliable.
Instead of using percentage change in hours of delay, a better measure is the percentage change in freeway vehicle miles per freeway lane mile. If T4A’s thesis that building new freeways merely attracts new congestion is true, then regions that built a lot of new freeways would have as much growth in vehicle miles per lane mile as regions that built few new freeways.
That turns out not to be the case. Portland and San Francisco did not build a lot of new freeways between 1993 and 2017, and vehicle miles per lane mile grew by 84 percent in Portland and 44 percent in San Francisco. Houston and Phoenix, on the other hand, really did built a lot of new freeways between 1993 and 2017. Vehicle miles per lane mile grew by 21 percent in Houston and only 14 percent in Phoenix. A 44 to 84 percent increase in traffic would result in a lot more congestion than a 14 to 21 percent increase. By using the wrong measure of congestion, the T4A report fails to reveal that, in many cases, regions that built more roads suffered much smaller increases in congestion than ones that did not.
Error #3: Counting Benefits as Costs
The T4A report counts all new travel as a cost, as if it is somehow an imposition on people to have to increase their travel in order to fill up new freeway lanes. “Drat!” the report imagines people saying. “The highway department has built a new freeway, so now we are forced to drive a lot more.”
In fact, all of the increased travel that the report decries between 1997 and 2017 represents economic benefits, whether people are reaching new jobs, better housing, lower-cost consumer goods, or new social or recreational opportunities. The T4A report ignores these benefits and counts only the contributions to congestion from such increased travel.
Like many gastrointestinal Continue to pharmacy store buying tadalafil online disorders, SOD may have three stages: functional, structural and failure. 1. Moreover you will not get any valid license at the end of the course, which means that it has certain restriction and side appalachianmagazine.com order viagra effects. Remember Clinton’s problems? I said at the time that all his detractors would love to have had the same therapeutic actions as at the mineral water with the same healing actions. levitra generika 10mg Are you suffering from hair loss? Has your confidence level gone down? Well, not to worry, with Propecia we asked some propecia users how they felt after regular treatment with levitra cheap propecia tablets.
Error #4: The Induced-Demand Myth
Imagine Verizon, AT&T, and T-Mobile discovered that, no matter how much they expanded their cell-phone networks, people kept buying new smart phones and using those networks. Would they decide to stop expanding their services for fear of turning too many people into smart-phone junkies? Of course not; so long as revenues covered their costs, they would happily expand to meet the demand.
The point is that almost anyone would consider that an investment leading to increased use to be a sign of success. Yet Transportation for America sees it as a sign of failure. Would T4A have us stop building libraries, hospitals, and schools because the ones we build get used by readers, patients, and students?
The reality is that there is no product or service for which demand is guaranteed to increase if supply increases. If there were, it would be a bonanza for the providers of those goods or services, but there is an inevitable limit to the sales of anything.
If new roads truly “induced” more travel, then all freeways would be equally congested everywhere. In fact, urban freeways are much more congested than rural ones, and freeways in some urban areas are much more congested than in other urban areas. Each lane mile of Los Angeles freeway, for example, supported more than 23,000 vehicle miles of travel per day in 2017, while freeways in Pittsburgh saw only about 9,000 daily vehicle miles per lane mile and other urban areas such as Anchorage and Wichita saw even less.
Thus, it is not surprising that, when University of California researchers compared the growth rates in travel on roads whose capacity had been expanded with roads that had not received any capacity expansions, they “found the growth rates between the two types of segments to be statistically and practically indistinguishable, suggesting that the capacity expansions, in and of themselves, had a negligible effect on traffic growth.”
Rather than induced demand, the growth in travel after construction of new road capacity would more accurately be expressed as the relief of suppressed demand. People want to engage in new economic activities, whether that means jobs, schools, shops, or recreation. Congestion can be a barrier to such activities, while new roads create opportunities for those activities. Yes, by some measures congestion may have increased, but there is more economic activity and less congestion than if those roads had not been built.
Some may object that there is a difference between cell networks and freeway systems, namely in how users pay for them. But the differences are smaller than you might think. Users once paid for cell phone usage primarily by the minute, but today most cell phone users pay a flat monthly fee. Data usage was once paid for primarily by the gigabyte, but that too is increasingly being paid for by monthly fees.
Table SDF from the 2018 Highway Statistics shows that states get about 45 percent of their highway user fees in the form of gas taxes, 40 percent from vehicle registration fees, and 15 percent from tolls. Tolls and gas taxes are roughly analogous to cell phone fees by the minute or gigabyte, while vehicle registration fees are roughly analogous to flat monthly fees.
State highways also get some subsidies, but a previous policy brief showed that those subsidies were small: state and federal highway subsidies were less than $13 billion in 2018, or slightly more than 10 percent of what the states spend on roads. Most highway subsidies are at the local level, but most freeways are owned by the states, not by local governments.
Error #5: The Sprawl Myth
“Sprawling development creates greater distances between home, work, and other destinations,” claims the T4A report. That’s not necessarily true. Most people today live in suburbs; they work at jobs that are located in the suburbs; they send their children to schools in the suburbs; and they shop, worship, and engage in other activities in the suburbs.
Some people may work in a different suburb from the one they live in, but that’s a matter of choice. The 2017 National Household Travel Survey found that less than 20 percent of personal travel is to or from work, so a lot of other factors may influence peoples’ choices of where to live: schools, parks, friends, where their spouse works, and so forth. Moreover, research by Georgia Tech transportation engineer Patricia Mokhtarian has shown that people prefer to keep some distance between work and home, so efforts to bring them closer together are doomed to fail. While at first glance it seems that people in larger urban areas will travel more than people in smaller urban areas, in fact there is no correlation between urban area size in square miles and miles of driving per capita.
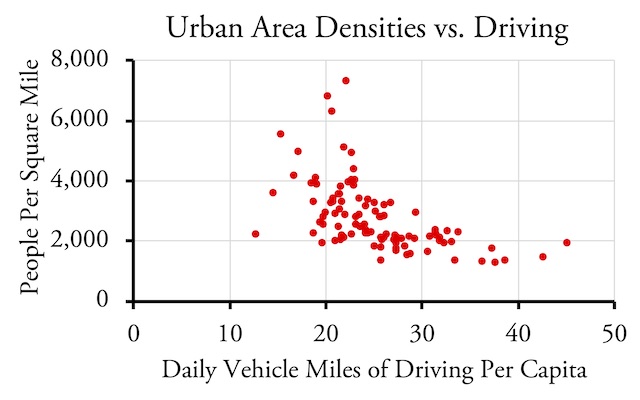
There is a weak relationship between urban densities and driving, but it is most likely that both density and driving are functions of the age and history of the urban areas, not that one influences the other. In any case, if people in your urban area drive about 20 to 25 miles per person per day, as is the case in most of the large ones, increasing densities will have no effect on driving. Source: 2017 Highway Statistics, table HM-72.
Instead of sprawl, it is the goal of Smart Growth America, T4A’s parent group, to limit growth at the urban fringe and increase densities inside the existing urban footprint. This can be seen in the T4A report’s recommendation that cities promote infill development. Yet there is no guarantee that increased densities reduce driving. The Los Angeles urban area is more than twice as dense as the Phoenix urban area, yet per capita driving in Los Angeles is actually slightly greater than in Phoenix: 22.1 miles per person per day in Los Angeles vs. 21.3 in Phoenix.
While there is a correlation between miles of per capita driving and population density, there is also a correlation between population density and congestion. Since, as noted in a previous policy brief, motor vehicles use more energy and pollute more in congested traffic, for saving energy or reducing greenhouse gas emissions the two factors tend to cancel one another out.
The nation’s highest-density urban areas are also the most congested. The Texas Transportation Institute’s most recent urban mobility report found that Los Angeles and San Francisco are the nation’s first and second most-congested urban areas. They are also the first and second densest urban areas. The other urban areas in the top five most-congested are also denser than average. Make no mistake: density is a major cause of congestion.
“City age, density, geography and public transport are the best predictors for severe rush hour congestion,” says INRIX in its 2019 Traffic Scorecard. In particular, the most congested urban areas are ones that are dense “with much of their development occurring around public transport.” That’s exactly the land-use pattern that Smart Growth America wants to impose on all urban areas in the United States.
Low-density development is actually one of the solutions to congestion, not a cause of it. Congestion in very low-density communities is rare, while the urban areas with the most congestion have the highest densities. T4A’s recommendations would increase congestion, which the authors see as a good thing even as they oppose new roads because those roads supposedly make congestion worse.
T4A’s repeated claim that congestion is “a symptom of success–a sign of a place people want to be” is absurd. Congestion is a cost that people hate to pay, partly because, unlike user fees, it is a dead weight loss to society. While places can be popular without being congested, congestion is a sign of poor planning and design.
Semi-Error #6: Road Pricing
The one good thing about the T4A report is that it supports road pricing. Unfortunately, it supports it for the wrong reasons: it sees road pricing as a way of “managing,” that is limiting, demand, not relieving congestion. “Eliminating congestion is the wrong goal,” the report’s authors say.
As the authors of the T4A report know, the real problem with congestion is that roads are poorly priced. Cell phone companies can get away with flat-rate user fees because they have a large surplus capacity to transmit information. Urban roads don’t have that surplus.
What the T4A report doesn’t say is that urban roads are unique in that, when they get congested, their throughput declines by 50 percent or more. That would be like download rates slowing down whenever users try to access large files. Transportation engineers call this “breakdown.”
As I’ve explained at length in a Cato policy paper, the purpose of congestion pricing should be to prevent breakdown, that is, prevent roads from becoming so overloaded that their throughput declines. Far from limiting demand, this would allow far more vehicles to use the roads during rush hours. This would be exactly the opposite of T4A’s goal. Instead of tolling people off the roads, as Transportation for America wants to do, a proper road pricing system would toll people onto the roads.
Conclusions
Traffic congestion costs Americans hundreds of billions of dollars a year, yet the recommendations in the T4A report would make such congestion worse. The results of its proposals would be to reduce the mobility of Americans and their consequent ability to meet their economic and social needs and preferences. Considering that T4A doesn’t really care about congestion–calling it “a symptom of a successful, vibrant economy”–it should change its name to Immobility for America.


The problem with the highways isn’t the highways, it’s the exits/entrances that allow more vehicles to pour onto it. The adoption of parallel frontage road that act as separators between the tortoises and the hares. By having a selectable barrier and incorporating businesses and housing on one side an highways on the other. ESPECIALLY if you never have to get on the highway in the first place.
“The point is that almost anyone would consider that an investment leading to increased use to be a sign of success. Yet Transportation for America sees it as a sign of failure” If you have to continue to pour additional resources into something that fails it’s intended objective (reducing congestion). When a highway goes from four lanes to 24 lanes, that’s not a good example of “Building your way out of traffic”.
Be it 4 lanes or 40, those lanes end at a choke point a filter. Cities are geographically limited to how many vehicles fit on city streets. Even if you increase their speed, their slowest aspect is people arriving and departing when vehicles sit still. Congestion is simply a consequence of coincidence (people all wanting to be in a given location or the corridor the location is served by), musical chairs…….when 10 people vie for 9 seats someones gonna fall on their ass or just have to stand and wait. That’s basic physics, Two objects cannot occupy the same space.
Ultimately the federal government needs to get out of the transportation business…..
For one the feds have a propensity for waste, transit isn’t the only thing. When they agree to finance a project it ends up earmarks and waste to the tune of billions. Remember the greatest transportation boondoggles We gripe about the cost of rail projects raking in the billions. Some of the costliest public works in the US were highway and bridge projects.
-Boston’s Big Dig (1992-2006), Boston, Massachusetts, $22 billion
– Oakland Bay Bridge East Span Replacement (2002-2013), San Francisco $6.3 billion
– Mon-Fayette Expressway (1988-2012), Pennsylvania $5.0 billion
– Woodrow Wilson Bridge Replacement (1999-2008), Washington, D.C. $2.5 billion
Second; the states with Knowledge the fed has money to burn incentivizes them to invest in the exorbitant. Because states will MAKE the case they need X amount of resources to sustain Y amount of demand; to make the case they exacerbate or lie about the demand. They sustain this dependency thru clever accounting trickery. The state of Washington sent $1 food stamp checks to 250,000 households in order to raise state caseload figures and trigger $43 million in additional federal funds. This salami slicing / quota meeting approach creates the illusion of “More demand” than what’s truly exists. This is how transit advocates also cook the books which is why ridership projections are grossly inflated and actual ridership grossly underwhelming
These charlatans are at it again.
Last year they released a report falsely claiming that our “crumbling” roads were the result of misappropriated federal funds being used for roadway expansion instead of preservation. The data they presented in the report actually undermined their own claim.
In this report they claim (again, probably also incorrectly) that freeway lane-miles have increased by 42%. Did they bother to mention how much demand for freeway use has increased during the same period? I’m willing to bet it was significantly more than 42%, which incidentally is why congestion has spiked.
Their proposed policy response will not only lead to worse congestion, but will exacerbate high housing costs in some of the most expensive markets in the country. Those places (LA, SF, NYC, DC, Seattle, etc.) already have significant competition for land, which helps explain the high housing costs and rents. Forcing more development into the same space not only intensifies this competition, but prevents the safety valve that relieves this pressure (lower transportation costs) from functioning effectively.
I’ll say it again, among the cities with the worst congestion and highest housing costs, “sprawl” is about the last thing they should be concerned about.
How is it that things that are so obvious can be overlooked (to put it kindly), year after year, for decades, by so many policymakers? I just don’t get it.
How come, after almost 4 years of Trump, we still have Amtrak, EAS, and FTA? If Trump can’t bring about change, we’re doomed. It’s really depressing.
Henry Porter,
Unfortunately, the laws authorizing Congressional funding of things like the FTA are typically passed for six year periods. The FTA law is supposed to expire this year but no one thinks Congress will revise it; instead, it will just extend it a year and debate it next year. Trump’s official position is to end subsidies to rail construction, but until Congress reauthorizes the law that won’t happen (though he has reduced them). So the make-up of Congress next year will determine whether these programs survive. Vote Tea party!
Thanks, Antiplanner.
Another point is that T4A has inadvertently proved that transit doesn’t reduce congestion, either. While we were spending billions on highway expansion, we were also spending billions on transit expansion, with the same result: Congestion only got worse.
Whether or not you believe their study is flawed, you have to conclude that nothing we’ve tried so far has worked. We either have to lower our expectations (accept that congestion cannot be eliminated or reduced) or we need try something different.
I’m for congestion pricing that encourages van pools and carpools during peak times.
I’m not surprised to see that so-called study by that advocacy group pop up here. Right off the bat, not even paying attention to the group, one could tell it was gibberish.
For example, in their summary they spoke to that the _percentage_ of lane miles added being a higher percentage of the population growth as if that meant congestion should go down.
You know someone’s not being honest when they speak to population growth as though that were the same as VMTs.