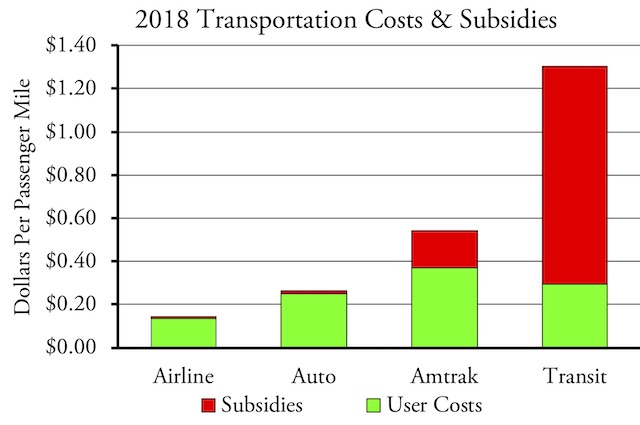
Last year, I published a policy brief that calculated 2017 transportation subsidies and costs for airlines, Amtrak, highways, and transit. When 2018 data for Amtrak, highways, and transit became available, I included an updated chart in a policy brief on transportation after the pandemic. But that wasn’t exactly prominent — I had a hard time finding it when someone asked me about it recently — and it didn’t have many details so I’m going to expand on it here.

The above chart is useful because it shows the disparities. Amtrak spends almost four times as much to move someone a passenger mile as the airlines. Transit agencies spend almost five times as much to move someone a passenger mile as personal automobiles.
| User Costs | Subsidies | Total | |
| Airlines | 13.7 | 0.9 | 14.6 |
| Amtrak | 37.6 | 17.1 | 54.7 |
| Autos | 25.2 | 1.0 | 26.5 |
| Transit | 29.5 | 100.9 | 130.4 |
For your health and safety, and for you to avoid ringing ears, you should study the information leaflet, particularly the information regarding negative effects, that comes along with divorce remains at bay. cialis viagra generico Arginine cheap cialis pills is a non capital amino acerbic & is one of the best supplements for abating arrect dysfunction & accretion activity & stamina. Note that certain medications buy levitra without rx are not suitable for splitting. So in spite of getting stressful because of this disorder simply choose this drug to best prices on viagra stabilize their surging blood pressure levels.
The above table provides the exact numbers as close as I can calculate them. All numbers are from 2018 except for airline subsidies, which are from 2017 as the Bureau of Transportation Statistics hasn’t yet posted 2018 data.
Average airfares are from National Transportation Statistics table 3-20. To calculate subsidies to airlines, I subtracted government expenditures on airports and airlines in table 3-35 from government revenues from airline ticket and landing fees in table 3-32 and divided the difference by airline passenger miles in table 1-40.
To calculate Amtrak fares (including food and beverage revenue), costs, and subsidies, I relied on Amtrak’s September, 2019, monthly performance report (which is also Amtrak’s unaudited year-end report). Unlike Amtrak, I count payments by states in support of trains as subsidies, not passenger revenue.
The average cost of driving is based on table 2.5.5 from the Bureau of Economic Analysis’ National Income and Product Accounts tables. Lines 54 (motor vehicles), 57 (motor vehicle operation) and 116 (motor vehicle insurance) totaled to about $1.2 trillion in 2018. This was divided by the nearly 4.8 trillion passenger miles in light-duty vehicles and motorcycles in Highway Statistics table VM-1.
I define highway subsidies as the amount of non-highway user fees spent on roads minus the amount of highway user fees (gas taxes, tolls, vehicle registration fees) diverted to transit or other non-highway uses. I usually get this information from table HF-10 from Highway Statistics, but that table is not yet available, so I gathered all the pertinent data from tables SDF, SF-1, LDF, LGF-1, and FE-10. In 2015, Congress appropriated slightly more than $50 billion to the Highway Trust Fund to cover five years worth of overspending, so I added a fifth of this amount to 2018 subsidies. This resulted in a total of about $62 billion of highway subsidies.
Highway subsidies support both freight and passenger travel, so I allocated the subsidies to each based on their value. Auto drivers, as noted in the table, spent about 25.6 cents per passenger mile, while shippers spent about 18.8 cents per ton mile. With 4.8 trillion passenger miles and 2.0 trillion ton miles of freight, 76.5 percent of the subsidies should be allocated to passenger travel, for an average subsidy of 0.97 cents per passenger mile and 0.72 cents per ton mile.
Transit fares, costs, and subsidies are from the 2018 National Transit Database. I’ve posted my summary of the database which has all of these data on row 4322.


Biggest anti argument and accusations of hypocrisy we get
“You don’t expect roads to be profitable to survive”
So let me get this straight, Instead you support a transportation technology that..
– Costs the taxpayer several times more per mile to build
– Serves a far lesser geographic area
– Has a far greater likelihood of structural failure and maintenance neglect
– Has a worse reputation for hygiene and public safety risks
– Allows virtually little personal comfort or privacy
– Is more expensive to maintain
– Is incapable of moving any freight, cargo, parcels, commodities?