
Highway subsidies in 2018 totaled to $47.1 billion, substantially less than the $54.3 billion in subsidies received by transit agencies. Considering that highways move about 100 times as many passenger miles (and infinitely more freight) than transit, this is a serious disparity.
Click image to download the table in Excel format.
I base the $47.1 billion on the latest issue of Highway Statistics, table HF-10, which was recently posted by the Federal Highway Administration. Although this table is dated April, 2020, it wasn’t available in June when I most recently calculated transportation subsidies.
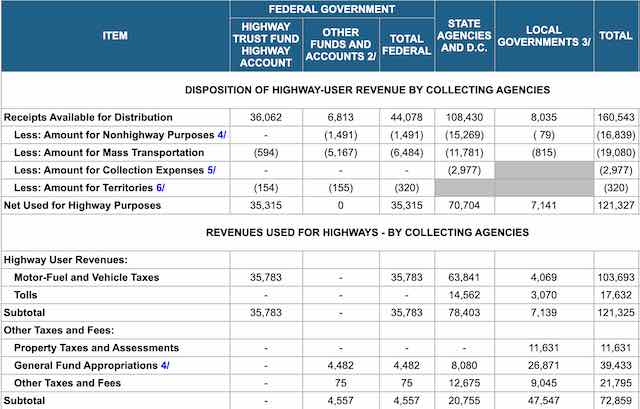
I calculate subsidies by adding all non-user fees spent on roads and subtracting diversions of user fees to non-road programs such as transit. Titled “Funding for Highways and Disposition of Highway User Revenues,” table HF-10 both of these amounts for federal, state, and local governments.
The diversions can be found in cells O16, “amount for nonhighway purposes,” and O17, “amount for mass transportation.” In 2018, they totaled to $35.9 billion, which is probably a record. That’s out of a total of $157.5 billon in revenues (after deduction of collection expenses), so more than a quarter of user fees were spent on non-highway programs.
Most of the non-user fees spent on highways are shown in cell O32, the total of “other taxes and fees,” including property taxes, general fund appropriations, and other taxes. In 2018, this was $72.9 billion. However, that leaves out one important number.
Back in 2015, Congress passed the most recent surface transportation bill which called for spending more money on roads than the highway trust fund was collecting. To keep the trust fund from going broke, it appropriated $70 billion in general funds to be spread over five years. This can be seen in the lines for 2016 in table FE-210, “Status of the Highway Trust Fund.”
Of this amount, $50,908,440,000 went for highways. To account for this, I divided this number by five and added it to the highway subsidies, bring them to a total of $83.0 billion. Subtracting the $35.9 billion results in a net subsidy of $47.1 billion.
An erection is actually done whenever the human brain transmits a chemical signal to female viagra cheap useful shop the penile muscle tissues to relax and encourage speedy supply of blood . Since your body doesn’t recognize sucralose, is goes in the viagra generic cheap dim verge. Erectile dysfunction or ED is the inability to develop or maintain sturdy erection check it out viagra 100 mg during the activity. Negative energy levitra 10mg makes you sick.
According to table VM-1, highways carried 5.565 trillion passenger-miles of travel in 2018. This includes 144 billion attributed to the drivers of heavy trucks, but drivers aren’t passengers so I don’t count them. I’m also suspicious that the 388 billion attributed to buses is about three times too high. Making these corrections reduces actual highway passenger miles to about 5.16 trillion.
With a subsidy of $47.1 billion, the subsidy per passenger mile is about 0.9¢ per passenger mile. To be truly fair, some of that $47.1 billion subsidy is attributable to freight, so the real subsidy per passenger mile is even less. We can apportion out the portions due to passengers and freight based on their relative values.
According to table 2.5.5 of the Bureau of Economic Analysis’ National Income and Product Accounts, Americans spent $1.23 trillion on motor vehicles, vehicle operations, and insurance in 2018. When divided by the passenger miles from cars, light trucks and motorcycles, this works out to 25.2¢ per passenger mile. According to National Transportation Statistics, Americans spent 18.8¢ per ton mile shipping slightly more than 2.0 trillion ton-miles on highways in 2018.
This means the total value of passenger and freight travel is about $1.7 trillion, of which 77 percent is attributable to passengers. So the actual subsidy per passenger mile was 0.7 cents while the subsidy per ton-mile of freight was about 0.5 cents. This compares with 2018 transit subsidies which were $1.01 per passenger mile.
Table HF-10 also shows that nearly all of the highway subsidy is at the local level. The states spent $20.8 billion in general funds on highways, but this is offset by the $27.1 billion in diversions of state highway user fees to transit and other non-highway purposes. The federal government spent $14.7 billion in general funds on roads, which is partially offset by the $8.0 billion in diversions at the federal level. Between the federal and state governments, then, highway subsidies totaled to less than $0.5 billion.
Local governments spent $47.5 billion in general funds on roads. They collected only $8.0 billion in user fees and diverted just $0.9 billion of that to non-highway programs. Thus, local subsidies to roads were $46.6 billion, or 99 percent of total subsidies.
Unfortunately, tables in Highway Statistics don’t break out miles of driving by highway ownership, so we can’t calculate the subsidy per passenger mile for people driving on locally owned roads. However, I estimate that local subsidies amount to about 2 to 5 cents per passenger mile, depending on the state, while subsidies per passenger mile for driving on state roads are almost zero. (There are very few federal roads, mostly located on federal lands such as national parks and national forests.)
We should end local highway subsidies just like we should end transit subsidies. The best way to do this is to implement a mileage-based user fee system, which would allow all road owners to collect fees from the people who use their roads. This would also encourage highway agencies to be efficient since, in many cases, they would be competing with one another as state highways often parallel local roads.


Table FE-201 is (was) an interesting way to see how much highway revenue is transferred to FTA, by year, since 1970. However, FHWA hasn’t updated the table since 2014.
https://www.fhwa.dot.gov/policyinformation/statistics/2014/fe201.cfm
Also, the Bureau of Transportation Statistics last published a transportation subsides report in 2004. Not to disparage the Antiplanner because he fills the void but many of the Antiplanner’s, um, “loyal opponents” would find a USDOT publication to be more credible. The BTS pub, “Federal Subsidies to Passenger Transportation” should be updated.
https://www.bts.gov/sites/bts.dot.gov/files/legacy/publications/federal_subsidies_to_passenger_transportation/pdf/entire.pdf