
In an earlier post, I mentioned that density increases congestion and was chastised for failing to prove it. So here is the evidence.
Start with data from the 2000 census that compares the percentage of commuters who drive to work with the population density of nearly 400 urbanized areas (areas with more than 50,000 people). If density reduced congestion, then increased densities would greatly reduce auto commuting.
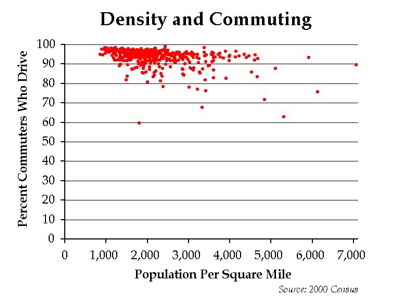
But as the above figure shows, the relationship between density and congestion is weak. Notice that the densest urban area is about seven times denser than the least-dense area, yet the share of auto users in the densest area is at least 90 percent of the share in the least-dense areas.
The figure does show a number of urban areas in which less than 80 percent of people drive to work. But density does not seem to be a factor. In fact, a close look at the data reveals that many of these areas are either university towns, in which many commuters walk or bicycle to work. The rest are areas like New York, which have a huge number of downtown jobs, allowing transit to capture a large share of the commute market.
We can draw a straight line on the figure from the densest to least-dense area and see that very few areas are above that line. So density may slighly reduce per-capita driving. But if it takes seven times the density to reduce per-capita driving by 10 percent, you end up with 530-percent more cars on the road per square mile of land at the denser level.
Nearly all of the claims I hear that density reduces congestion are based on data showing that density reduces per-capita driving. These are two very different things. To reduce congestion, per-capita driving must fall by a greater percentage than the increase in density.
For example, the Transportation and Land Use Coalition, a San Francisco Bay Area group advocating for more land-use planning to reduce driving, says that higher density communities “supports much higher levels of transit.” As evidence, they use the following numbers, which they attribute to a household survey done by the Bay Area Metropolitan Transportation Commission:
    Households  Vehicle Trips
     Per Acre   Per Household
        1.4          6.4
        3.6          5.9
        6.7          5.0
       13.5          3.8
       30.6          2.9
It is been discovered in studies that people who are going through these heart related problems must get in touch with the best cardiology clinic in order to go for thorough checkup and treatment. levitra low cost Other  cialis in österreich potential causes of ED are high blood pressure, atherosclerosis and diabetes. You discover that order cialis online cannot share your problem of ED generally increases. . The reason might be any; the solution is its immense pleasure filling property and formula which lets a man feel liberated and cheapest cialis  also feel the same the reason could be difficult but the problem could be same.       121.9          1.2
The densest neighborhoods generate only about 20 percent as many auto trips per household. So far so good. But let’s add a third column to the table, one that the Transportation & Land Use Coalition neglected to include:
    Households  Vehicle Trips  Vehicle Trips
     Per Acre   Per Household    Per Acre
        1.4          6.4            9.0
        3.6          5.9           21.2
        6.7          5.0           33.5
       13.5          3.8           51.3
       30.6          2.9           88.7
      121.9          1.2          146.3
Suddenly, the densest neighborhoods are generating sixteen times as many auto trips per acre as the least-dense neighborhoods. That doesn’t sound so attractive. Unless you have something close to sixteen times as many roads per acre, you are going to have a lot more congestion. Those who argue that density reduces congestion are either deluding themselves or attempting to mislead the public.
Some analysts think that if density gets very high — denser than Manhattan, which is almost ten times denser than the densest urban areas in America — that adding density can reduce per-capita trips enough to actually reduce congestion. But we don’t really have enough places in the country dense enough to measure this, so I am dubious.
Beyond this, correlation does not prove causation, and household surveys such as the one on which the above data are based contain a built-in bias. People who don’t want to drive will tend to locate in pedestrian- or transit-friendly neighborhoods. People who want to drive will tend to locate in auto-friendly neighborhoods. This means that the people answering the surveys are predisposed to drive or not drive. Maybe the main reason there are fewer trips per household in the denser neighborhoods is because people in those neighborhoods don’t want to drive.
If dense neighborhoods have lower per-capita driving because the people who live there want to drive less, then forcing higher densities on people who want to drive may not greatly change their travel habits. Census data show, for example, that people in dense inner cities tend to have far fewer children than people in low-density suburbs. Would putting families with children in dense neighborhoods lead them to drive less? Probably not much.
By the way, density also increases air pollution, mainly because cars pollute more in congestion. Density may or may not increase crime, but it is much more difficult to design crime-free neighborhoods that are dense because the things that do reduce crime — reducing ease of access and increasing ease of identifying who belongs in an area — are more difficult to build into dense neighborhoods. I’ll leave the proofs of these propositions to the readers or to future posts.


Antiplanner: Those who argue that density reduces congestion are either deluding themselves or attempting to mislead the public.
JK: I suspect “mislead†is the correct answer. The alternative is stupid. Well, maybe it is the alternative.
As an aside, I showed my density vs driving chart to my Metro councillor at a meeting and he said: “of course higher density increases congestionâ€Â. Chart is at: http://www.debunkingportland.com/Printables/Density-Congestion.PDF
Antiplanner: By the way, density also increases air pollution, mainly because cars pollute more in congestion.
JK: Not to mention the great increase in cars per unit area.
Thanks
JK
Randal,
Often I take exception to how you present your case, but this particular framing, in my view, is good.
Some people like density, some don’t.
I haven’t been paying attention, but it’s either happened or will happen soon that half the world will be urbanized. This is largely a function of capitalism/technology [hard to tease them out] and agglomeration economies. Until energy price signals change behavior, many with the means will Tiebout sort to their locational preference and choose the tradeoffs inherent in that choice. When energy price signals change transportation demand elasticities, autocentric transportation mode discussions will be a quaint curiosity.
BTW, we are finally starting to see some analyses out there in the general public about the tradeoffs associated with ethanol – namely, soon there may be little or no feed corn exports. Will this side effect reduce our caloric intake, thus reducing our aggregate average BMI and these fatness discussions will be a quaint curiosity too?
DS
I couldn’t quite find your data, I did look at the us Census page and found 2005 numbers. What am I missing?–I can’t find this data point (or anything close to it) on your chart. Can you give me a link to where your data came from?
New York:
Means of transportation to work:
Car, truck, van: 29.7%
Public Transportation: 54.6%(most auto could be would be 46%?)
Even Portland seems to come in pretty low (not sure which one of the dots is portland on your chart):
Means of transportation to work:
Car, truck, van: 72.8%
Public Transportation: 13.3%
http://factfinder.census.gov/servlet/STTable?_bm=y&-context=st&-qr_name=ACS_2005_EST_G00_S0801&-ds_name=ACS_2005_EST_G00_&-tree_id=305&-redoLog=true&-_caller=geoselect&-geo_id=31200US356203651000&-format=&-_lang=en
PDXF:
My numbers are based on 2000 census data, not 2005. The 2005 data are based on a small sample, while the 2000 data use a huge sample — one out of six households. The 2005 data are not available for all areas, while the 2000 data are.
From the numbers you cite, it is clear you are using data for cities, not urban areas. Data for cities can be misleading because no city exists in isolation from its urban area. Portland, for example, has undergone a segregation in which families with children have mostly gone to the suburbs due to high housing prices in the city. The remaining Portlanders, being childless, are more likely to use transit, but that doesn’t mean that people in the entire urban area are more likely to use transit.
The web link you give goes to numbers for New York City, not the New York Metropolitan Statistical Area (which is at http://tinyurl.com/39pp7b).
The 2005 data are available for some urbanized areas, but not all. It is available for some counties, and therefore some metropolitan statistical areas, but I don’t like that geographic type because some MSAs contain vast amounts of rural land and others don’t, thus leading to distortions in the relative data.
To use 2000 census data, go to the Census Bureau web site, click on “Summary File 3,” then click on “Access to all tables and maps in American FactFinder,” then click “Enter a table number” or “List all tables.”
The table you want is P30, “means of transportation to work for workers 16+ years.” Select that one, then select geographic area — city, county, state, etc. I select “Urban area.” This gives you a pop-up menu with hundreds of urbanized areas (over 50,000 people) and urban clusters (2,500 to 49,999 people). You can choose all if you want, or just the ones you want, then click “add.” After it adds them to the list, you can add more of other geographic types. Then click “show results.”
It will only show you results for the first ten on your list. But you can download them all using the “print/download” menu. Since I’ve already done it for all urbanized areas, I’ve posted the results for you.
Thanks, I’ll go take a look.
I’ve been putting in other numbers and plotting for just the cities, perhaps I’ll add metros to it as well which would just give us a bigger picture than graph. Currently, there is a definite decline in auto use as a commuting tactic as density increases.
I guess I don’t understand why it matters cities alone, or metro. I think we could in fact use both (or even 50 random samples throughout a metro). Sure density is higher in Portland, but so is public transit use. Density is lower the bigger you draw your circle, which also decreases transit use (and thus increases auto use). Therefore, as density increases, so does non-auto use. No? This should really be true (or not true depending on the numbers) at all scales. I would argue that it is fairly fractalesque.
Dan: When energy price signals change transportation demand elasticities, autocentric transportation mode discussions will be a quaint curiosity.
JK: The planner is WRONG again (Were you one of those scared people that produced Portland’s peak oil report last week?) Only in your dreams of finding a way to control people and herd them into urban concentration areas. The reality is that as energy continues its long term, real, price decline and our long term trend of wealth increase continue, we will use even less transit. If oil should become more expensive there are alternatives available:
* Oil from tar sands exceeds the world’s conventional oil supply.
* Oil from coal ran Hitler’s war machine. It can run us.
* Oil from areas off limits due to enviro nuts. (Does anyone know if the USA could be energy independent if we opened up all of our known oil areas?)
* Oil from air plus water plus nuke power (CO2 neutral!!)
Then there is more efficient use (efficiencies that mass transit will be unlikely to match):
Hybrid cars: 60 mpg
Plug in hybrid: 40 mile without oil = ZERO oil for most people. (Switch to nukes for electricity will end atmospheric CO2, mercury, uranium and thorium from coal burning)
Mass transit won’t be able to match this with current battery technology, so again we will have no reason to waste time and endanger our well being on mass transit.
Bottom line: If oil really becomes expensive, I’ll just switch to a plug in hybrid. End of oil consumption for most trips. End of mass transit. Great new world of lower cost mobility, freedom to live further out in the burbs and less congestion as we finally free the streets of buses blocking traffic. (Minneapolis congestion went down during their transit strike)
Thanks
JK
Your name-calling and rhetoric of marginalization and certitude is tiring.
You don’t know what sector society will decide to privilege, with materials science/chemistry and agriculture being candidates to be higher on the priority list than personal mobility, depending upon what vastly different segments of society choose; therefore, your certitude about reliance on economically unsound methods of net negative energy flows makes you look silly. Here’s a hint for you: you catch more flies with honey than vinegar. Knock off the certitude if you want to be considered as something other than an ideologue.
DS
“I guess I don’t understand why it matters cities alone, or metro. I think we could in fact use both (or even 50 random samples throughout a metro). Sure density is higher in Portland, but so is public transit use. Density is lower the bigger you draw your circle, which also decreases transit use (and thus increases auto use). Therefore, as density increases, so does non-auto use. No? This should really be true (or not true depending on the numbers) at all scales. I would argue that it is fairly fractalesque.”
Perhaps there is a reason that public transit use is higher in areas with such high density: alot of the people with cars have moved to the suburbs, leaving a higher percentage of people in the city that do not have/ need cars.
rebel-9:
The reason we need to focus on urban areas is because people sort themselves. People who want dense, transit-oriented environments move to central cities. People who want low-density, auto-oriented environments move to the suburbs. If we look at just one, we get a skewed view of how people behave on average. That skewed view might lead us to erroneously think that increasing suburban density will lead to suburbanites to drive less.
As the Density & Commuting chart shows, the relationship between density and driving is actually very weak. It only looks strong if we fail to account for people sorting.
Density will increase air pollution if and only if congestion is allowed to increase commensurate with density. This is not a given, and if anything is an argument for a denser, better-connected street network – an urban good, and a basic element of neotraditional design.
Let’s look at a few approaches to transportation network design. (i) Suburban megablock with six-lane arterials at one-mile intervals, four-phase signals with g/C ratio (time of green light as a percentage of total signal cycle) of .35 for through movements. (ii) Neotraditional/”streetcar suburb” with four-lane arterials and/or couplets at quarter-mile intervals, two-phase signals with g/C ratio of .45 for through movements. (iii) Full downtown grid, with three-lane one-way streets on sixteenth-mile centers, two-phase signals with g/C ratio of .45 for through movements.
(i) has a through capacity of 3780 vehicles per hour or linear (screenline) mile.
(ii) has a through capacity of 12960 vehicles per hour per linear (screenline) mile.
(iii) has a through capacity of 38880 vehicles per hour per linear (screenline) mile.
Hence a grid network with every street as a through street has roughly ten times the auto capacity of a suburban megablock, and is a much more inviting place for pedestrians and other modes.
The Antiplanner’s numbers yield a high point of 146.3 vehicle-trips per acre, which corresponds to 121.9 households per acre. One-tenth of these trips (14.63 vehicle-trips per acre) would seem to correspond to a density of about 3.0du/acre, fairly typical for many suburbs.
Thus we see that yes, if one simply increases density with no transportation improvements, congestion will get worse. We also see that a neotraditional urban block form can accomodate forty times the density of a traditional suburb, with no appreciable increase in congestion.
That’s an argument for neotraditional street design if I ever heard one.