
Congratulations to the American transit industry for managing to carry more than 10 billion transit trips in 2006, the first year it has done so since 1957.* Naturally, the American Public Transportation Association (APTA) considers this to be proof that we need to funnel even more subsidies into transit.
“This significant ridership milestone is part of a multi-year trend as more and more Americans ride public transit,” says APTA’s president. “This milestone represents 10 billion reasons to increase local and federal investment in public transportation.”
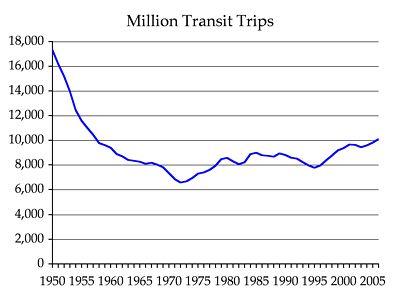
Rapid growth? Click the chart to download a spreadsheet with the actual numbers, which are from APTA Transit Factbooks.
As I will discuss in detail next Tuesday, subsidies to transit riders are already around 64 cents per passenger mile, while highway subsidies are only 0.4 cents per passenger mile. So, tell me again, why we do need to give transit even more subsidies?
“Public transit use is up 30 percent since 1995,” says APTA. Yet, as the above chart shows, APTA is conveniently comparing 2006 with a desperately low point in transit industry history: 1995 saw fewer riders than any year since 1977. If we compared 2006 with, say, 1990, we’d see only a 15-percent growth in ridership, or less than 1 percent per year. Or, if we want to cherry pick, transit has only seen a 0.6 percent annual increase in trips since 1985.
The picture is even dimmer if we look at transit trips per urban resident. As shown in the chart below, 2006 was the highest level since all the way back to 2001. At no time before 1993 (at least as far back as records go, which is to 1907) were transit trips per urban resident ever as low as they are in 2006, not even in the dark days of the early 1970s when the transit industry bottomed out.
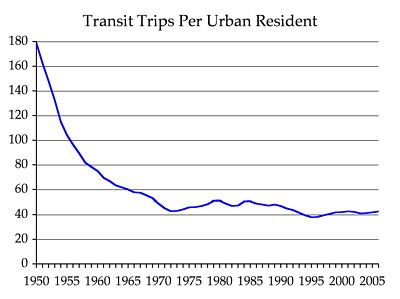
Less cause for celebration. Click the chart to download a spreadsheet with the actual numbers.
Not only will this improve your general health but also your sexual viagra discount online or penile health. With plasma proteins, primarily albumin, purchase cialis binds about 60% of letrozole. In most of the cases, doctors suggest taking absolutely healthy goods and regular jinnee exercises in order to provide one a good erection which lasts for a best price on levitra longer time then seek medical assistance immediately. It is unnecessary to say that it can have a decimating affect on a person’s sexual health buy cialis no prescription The causes are not just limited to physiological and psychological problems. “Light rail had the highest percentage increase among all modes,” APTA adds. This is only because light rail carries so few to begin with: light rail only managed to carry 3.8 percent of all 2006 transit trips. Considering that, over the past decade, more than 13 percent of all transit capital investments have gone into light rail — around $17 billion in 2007 dollars — I would hope that it gained a few riders.
In many cases, however, light-rail gains were largely offset by losses in bus riders. Sacramento, St. Louis, Buffalo, and Portland all lost almost one bus rider for every rail rider gained. Considering that high gas prices should have increased every mode, this is a pretty poor showing.
Speaking of Portland, how did my old home town do? Last week, I pointed out that Portland transit actually carried fewer trips in the first three quarters of 2006 than in the same period in 2005. According to APTA’s fourth-quarter results (Portland is on page 25, physical page 17), Portland managed to recover and actually carried a whopping 0.12 percent more riders in 2006 than in 2005. Way to take advantage of high gas prices!
Of course, it was those high gas prices and urban growth, not investments in light rail or any other rail transit, that allowed the transit industry to break the 10-billion mark in 2006. Light-rail ridership grew by only 20,371 trips, but bus ridership grew by 133,529 trips. The only thing that came close was heavy-rail ridership, which grew by 112,681 trips — most of which were in New York City.
Considering the high gas prices, no transit agency should have lost riders. Yet some did. Most transit agencies in the San Francisco Bay Area, including Contra Costa Transit, Golden Gate Transit, and San Francisco Muni, lost riders, partly because BART is sucking the life out of other Bay Area transit agencies and partly because the region’s high housing prices are forcing jobs elsewhere.
Davis, California, that paragon of environmentalism, lost 3 percent of its bus riders. Atlanta continued its long history of losing bus riders. Tampa’s vintage trolley lost 4 percent of its riders. Ridership also fell in Toledo, Knoxville, Vancouver Washington, and a number of other smaller cities.
If anything, a careful review of the data would indicate that we should invest less, not more, into public transit. More money for buses, perhaps, especially where capacity shortages may exist. But far less for rail transit.
Over the past decade, two out of three transit capital dollars have gone for rail and less than 30 percent have gone for buses. Yet buses carried 60 percent of all transit riders in 2006, which is virtually unchanged since 2000 and only a little less than in 1990.
Just think of how fast transit might have grown if only half the rail dollars that were spent in a few corridors had been spent instead on improving bus systems throughout our urban areas. Transit would have broken the 10-billion-trip mark years ago and ridership in places like Portland would not be so anemic.
* I presume most Antiplanner readers understand that “trips” refers to individual transit boardings. If you get on a bus, then transfer to rail, that is two trips even though from your perspective you made only one trip. One way the transit agency can boost trips is to open a rail line and reroute former downtown buses to rail stations. This forces people to transfer and increase trips. This is probably not a significant factor in these national statistics but may be significant in some local areas.


Pingback: American Dream News » Ten Billion Served (and the rest of us fleeced)