Transit Fatality Rates on the Rise

Transit fatality rates have risen from 4.6 per billion passenger miles carried in 2002 to 5.8 per billion in 2016. Among major forms of transit, hybrid rail (diesel-powered rail cars that often run on light-rail schedules) is the most dangerous, killing 29 people per billion passenger miles. Light rail is next at 13, while buses and heavy rail are both less than 5.

These numbers are from the Federal Transit Administration’s safety and security time series, which counts fatalities and injuries by mode. The FTA’s spreadsheet also includes fatality numbers for 2017 and January of 2018, but does not have passenger miles for those years, so we can’t calculate rates. I’ve summarized the data in a spreadsheet showing fatalities and passenger miles by mode and year.

Commuter rail is not included on the FTA spreadsheet as that is governed by the Federal Railroad Administration. You can find commuter rail fatality numbers in table 2-34 of National Transportation Statistics. Comparing these fatalities with passenger miles reported by the National Transit Database historic time series indicates an average commuter-rail fatality rate of about 8.8 per billion passenger miles. Continue reading

2016 Road Fatalities Increase by 5.6 Percent

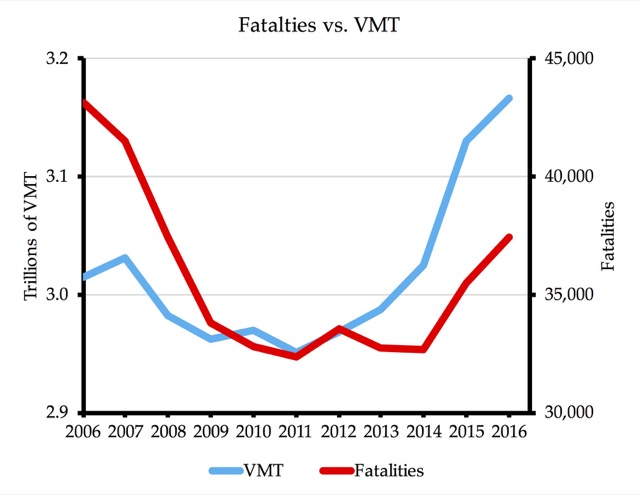
The National Highway Traffic Safety Administration (NHTSA) released its final calculation of 2016 crash fatalities, finding 37,461 traffic deaths, compared with 35,485 in 2015. The only good news is that the 5.6 percent increase was less than 8.4 percent increase from 2014 to 2015.

This is the highest number of traffic fatalities since 2007. After that year, there was a dramatic decline in fatalities to a low of 32,367 in 2011. Though fatalities had remained roughly constant at about 42,000 per year from 1995 to 2007, they suddenly declined by 10 percent in 2008 and another 10 percent in 2009. Fatality rates — deaths per billion vehicle miles driven — had been declining for more than a century, but traffic experts could not explain why there was a large decline in total fatalities in that two-year period. Continue reading

Relieving Congestion Saves Lives

As the Antiplanner observed yesterday, driving increased by 3.5 percent in 2015. Along with that increase came an 8 percent increase in traffic fatalities, according to the National Safety Council.

Six years ago, data revealed that 2009 traffic fatalities had declined by nearly 10 percent from 2008, which itself had nearly 10 percent fewer fatalities than 2007. This dramatic change left many experts perplexed. Some credited safer cars, but the Antiplanner suggested that much of the decline had resulted from the recession-induced decline in driving: 2009 miles were nearly 1 percent less than 2008’s, which were nearly 2 percent less than 2007.

If a slight reduction in congestion due to less driving could result in such a large decrease in fatalities, then similarly a reduction in congestion due to increased roadway capacity or other congestion-reducing measures could similarly save lives. Conversely, the Antiplanner suggested, cities that deliberately allowed congestion to increase in order to get people to stop driving were killing people.

Continue reading