About The Antiplanner

The Antiplanner is a forester and economist with more than fifty years of experience critiquing government land-use and transportation plans.

International Housing Affordability

Most major cities that were unaffordable in 2022 became even more unaffordable in 2023, according to Wendell Cox‘s latest annual report on international housing affordability. The major exception is in New Zealand, where land-use reforms have led to a home construction boom and increased housing affordability.

Click image to download this 3.3-MB 33-page PDF.

He has been doing these reports since 2005 so this may be his 20th report (though he may have missed 2021). This year’s report, which is based on data from the third quarter of 2023, examines affordability in 94 housing markets in eight English-speaking countries: Australia, Canada, China (Hong Kong only), Ireland, Singapore, the United Kingdom, and the United States. Of these 94 markets, the least affordable are Hong Kong, Sydney, and Vancouver while the most affordable are Pittsburgh, Rochester, and St. Louis. Continue reading

Who’s to Blame for Increase in Cycling Fatalities?

The National Highway Traffic Safety Administration (NHTSA) recently reported that more than 1,100 bicycle riders died in U.S. traffic accidents in 2022. That’s a 77 percent increase from 2010 and the most bicycle fatalities in recorded history (which goes back to 1932).

Do bike lanes make streets safer for bicycle riders? Photo by Missouri Bicycle Federation.

Bicycle advocates blame the increase on larger automobiles, particularly pickups. But the numbers don’t necessarily bear that out. In order to reduce fatalities, they want “safer street designs,” but the numbers don’t support that either. Continue reading

SEPTA’s Bus Revolution Not Revolutionary Enough

The Southeastern Pennsylvania Transportation Authority (SEPTA) is planning to revolutionize its bus network next year. While transit systems are due for a revolution, the agency’s plan isn’t revolutionary enough.

Click image to go to a map comparing SEPTA’s current dense bus routes (left) with the proposed sparser bus network (right).

The problem with most bus systems is that they focus on downtowns to the exclusion of the rest of the region. Before the pandemic, half of all workers in downtown Philadelphia took transit to work, but only 8 percent of the region’s workers worked downtown. The bus system did such a poor job of serving the rest of the region that less than 6 percent of workers who didn’t work downtown commuted by transit. Continue reading

Transit $60 Million in the Hole? Build a Monorail!

In case anyone believes that transit advocates haven’t completely lost their grip on reality, take a look at Memphis. The new CEO of the Memphis Area Transit Authority (MATA) has “discovered” a $60 million deficit in the agency’s budget that “prior leadership was unaware of.”

Memphis’s transit agency can’t afford to keep its streetcars running and has a $60 million deficit, so naturally people want to build a monorail or light-rail system. Photo by Charles Phillips.

How can you not be aware of a $60 million deficit? According to the new CEO, before she took the job, “MATA’s executive leaders did not have access to the company’s detailed financials.” Why not? How could anyone claim to be a leader and not demand access to financial information for the entity they were supposedly leading? Continue reading

The Great Post-Pandemic Population Shift

A little more than half of America’s incorporated cities collectively lost 2.7 million residents between 2020 and 2023, according to estimates released by the Census Bureau earlier this week. New York City alone lost almost 500,000 residents, or 5.5 percent of its population, while the next 20 biggest losers together lost about half a million people.

Moving day. Photo by James Fee.

The biggest losers, other than New York City, were Chicago (-78,877), Los Angeles (-74,934), San Francisco (-61,530), Philadelphia (-50,142), San Jose (-39,664), and Portland (-22,846). San Francisco’s population slightly recovered between 2022 and 2023, but most major cities that have lost population have seen declines in every year from 2020 to 2023. Continue reading

March Driving 101.4% of 2019

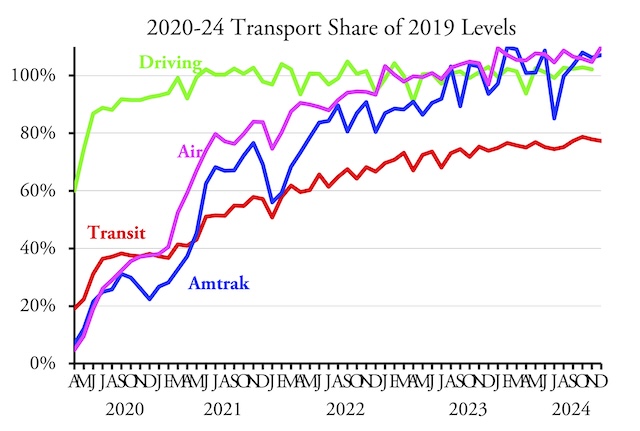
Americans drove almost 1.5 percent more miles in March of 2024 than in the March before the pandemic, according to data released yesterday by the Federal Highway Administration. Miles of driving have been at least 100 percent of 2019 numbers in six of the last eight months and at least 99 percent in 28 of the last 36 months.

Rural driving was 9.1 percent greater than in 2019 while urban driving was 1.8 percent less. The states with the biggest growth in driving are Indiana (33.8%), Montana (25.2%), Louisiana (23.0%), Arizona (17.0%), Idaho (16.6%), and Rhode Island (13.7%). The District of Columbia also saw 16.2 percent more driving in March 2024 than in 2019. Continue reading

Transit Carried 75.6% of 2019 Ridership in March

My trip through the Owyhee River Canyon went very well, thank you, except for a flat tire on my return home. The transit industry seems to be suffering from a perpetual flat tire, as it carried only 75.6 percent as many riders in March of 2024 as it did in the same month in 2019, according to data posted last week by the Federal Transit Administration. That’s down slightly from 76.0 percent of daily riders in February (adjusting for leap day and correcting for data missing in February’s report). March had the same number of business days in 2024 as in 2019 so no adjustment is necessary there.

The Federal Highway Administration has not yet posted March highway data, but I’ll post an update here as soon as it does.

A handful of major urban areas — Kansas City, Richmond, Oklahoma City, and Tucson — have seen ridership recover to 100 percent of pre-pandemic levels, but this is often because they have eliminated transit fares. From an economic viewpoint, you can’t say there is a significant demand for your service if you have to give it away for large numbers of people to use it. Continue reading

Amtrak Carries 109% of 2019 Passenger-Miles

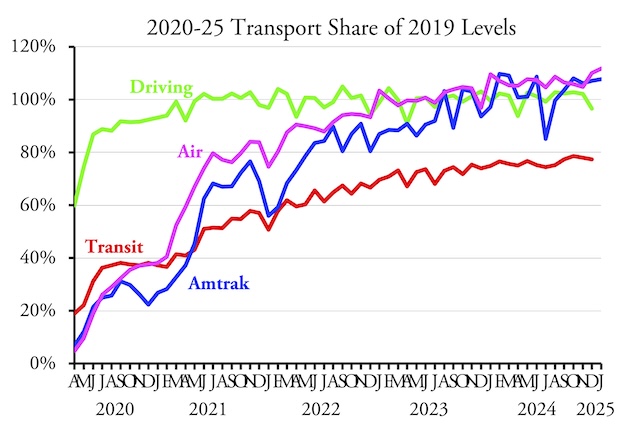
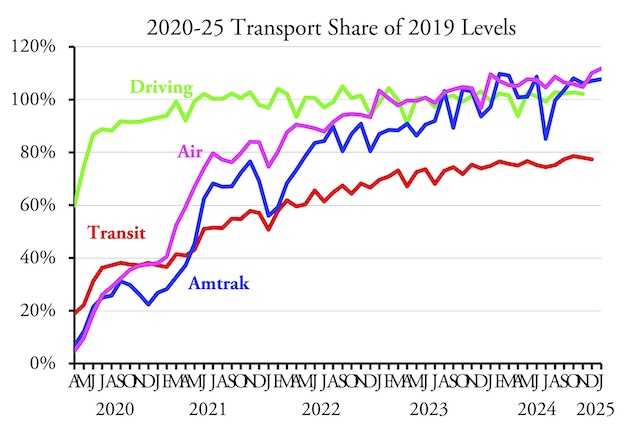
Both Amtrak and the airlines have fully recovered from the pandemic. The airlines carried 105.5 percent as many passengers in March 2024 as March 2019, according to data released by the Transportation Security Administration. Amtrak carried 109.1 percent as many passenger-miles in March as in the same month before the pandemic, according to the state-owned company’s monthly performance report.

The airlines have been around 100 percent at least since January of 2023, while Amtrak has been there since August of 2023. Driving data are not yet available for March but driving has been hovering around 100 percent of 2019 levels since July of 2021. March data for transit, the only mode that hasn’t recovered from the pandemic, should be available soon, but I will be on a river trip next week so won’t be able to post those data until the week after.

A Look at the Wacky Transit Industry

Today is Earth Day, a day in which we are supposed to celebrate environmentally friendly ideas such as public transit, high-density development, and electric vehicles. My report published last week revealed that the transit lobby has hijacked affordable housing funds so that, in many cities, most of those funds are spent on expensive high-density transit-oriented developments rather than on more affordable low-rise housing.

The Federal Transit Administration has recommended that Congress fund the Inglewood Transit Connector, a $2.0 billion people mover that will be just 1.6 miles long.

Last month, the Federal Transit Administration released its 2025 funding recommendations for transit capital improvements. This allows us to see some of the wacky ideas that the transit industry has come up with in recent years. Continue reading

The Affordable Housing Industrial Complex

Taxpayers spend billions of dollars a year subsidizing so-called affordable housing, but much of that money is wasted, says a new report from the Cascade Policy Institute. Affordable housing being built today actually costs much more than market-rate housing, and most of the benefits from building such expensive housing are captured by the developers, not low-income families who need housing.

Click image to download a 3.0-MB PDF of this report.

The report, which was written by the Antiplanner, reviews hundreds of housing projects built in the last 35 years to show that the nature of the typical project has changed from inexpensive low-rise apartment buildings to mid-rise and high-rise apartments that cost several times as much to build per square foot. The result — as noted in an Antiplanner post last December — is that the number of housing units built has declined despite a doubling of money spent subsidizing affordable housing. This has effectively cheated both taxpayers and people dependent on affordable housing. Continue reading