May Driving Exceeds Pre-Pandemic Miles

Americans drove almost 288 billion miles in May 2022, compared with 286.4 billion in May 2019, according to data released yesterday by the Federal Highway Administration. This represents a 0.5 percent increase over pre-pandemic levels. Considering that regular gasoline prices were under $3 a gallon in May 2019 and around $4.50 a gallon in May 2022, this suggests that high fuel prices aren’t leading many Americans to abandon autos for transit or other modes.

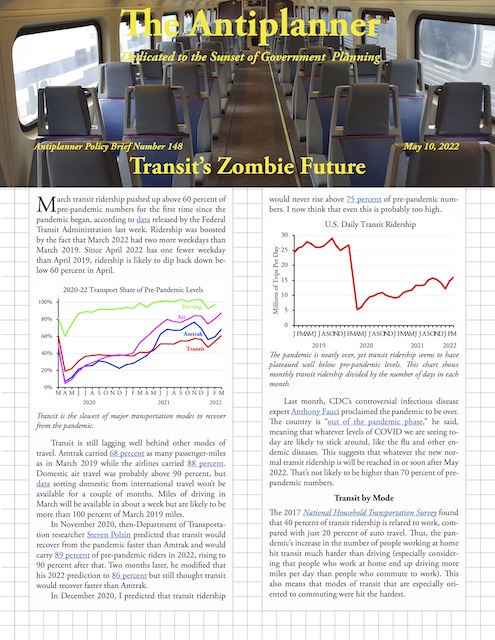
While transit ridership appears to have plateaued at 60 percent of pre-pandemic levels, miles of driving have exceeded pre-pandemic numbers for most of the last year.

Transit advocates are increasingly promoting free transit for everyone, regardless of income, as a solution to transportation equity issues, when in fact transit practically irrelevant to 95 percent of American workers (including low-income workers) before COVID, and even more since. The real inequity is in low automobile ownership among low-income households, and that inequity can be reduced without giving everyone, regardless of income, free cars.

May Transit 59.5% of Pre-Pandemic Levels

Transit ridership remained below 60 percent of pre-padenmic levels in May 2022, according to data released by the Federal Transit Administration yesterday. This was only a slight improvement over April’s 58.7 percent despite average fuel prices climbing from a little over $4 in April to more than $4.50 in May.

Amtrak passenger miles, meanwhile, reached 78.5 percent of May 2019, a 5 percent climb from April. Air travel remained right around 90 percent of pre-pandemic levels. Driving data will be released later this month. Continue reading

April Transit Falls to 58.7% of Pre-Pandemic Levels

Transit ridership in April 2022 was 58.7 percent of April 2019, according to data released yesterday by the Federal Transit Administration. This is down from March, when ridership was 61.0 percent of March 2019. When I reported on March numbers, I predicted that April’s numbers would fall below 60 percent of pre-pandemic levels because April 2022 had one fewer business day than April 2019, while March had two more than in 2019.

While airline and Amtrak numbers grew in April (as a percent of 2019 levels), transit numbers fell.

For comparison, airline numbers exceeded 90 percent of pre-pandemic levels (which I also predicted) while Amtrak ridership grew to 73 percent (though that’s a drop from November, when ridership was more than 77 percent of November 2019). Driving numbers won’t be out for another week or so, but will probably be around 100 percent. Continue reading

March Driving 2% More Than Before the Pandemic

Americans drove 2.1 percent more miles in March 2022 than in March 2019, thus returning to more than 100 percent of pre-pandemic levels, according to data released late last week by the Federal Highway Administration. Driving first exceeded 100 percent of pre-pandemic in July 2021 and remained above 100 percent through the end of the year. It then dipped below 100 percent in January and February, but now is back above 100 percent.

See this post for sources of data for air, transit, and Amtrak.

As noted here before, air travel is approaching 90 percent of pre-pandemic levels, while Amtrak is still below 70 percent and transit has just barely breeched 60 percent. I suspect transit will fall below 60 percent in April as March 2022 had two more work days than March 2019 while April 2022 had one fewer work day than April 2019. Continue reading

Transit’s Zombie Future

March transit ridership pushed up above 60 percent of pre-pandemic numbers for the first time since the pandemic began, according to data released by the Federal Transit Administration last week. Ridership was boosted by the fact that March 2022 had two more weekdays than March 2019. Since April 2022 has one fewer weekday than April 2019, ridership is likely to dip back down below 60 percent in April.

Click image to download a four-page PDF of this policy brief.

Transit is still lagging well behind other modes of travel. Amtrak carried 68 percent as many passenger-miles as in March 2019 while the airlines carried 88 percent. Domestic air travel was probably above 90 percent, but data sorting domestic from international travel won’t be available for a couple of months. Miles of driving in March will be available in about a week but are likely to be more than 100 percent of March 2019 miles.

Continue reading

February Driving 97.1% of Pre-Pandemic Miles

Americans drove almost 236 billion miles in February 2022, according to data released yesterday by the Federal Highway Administration. This was 97.1 percent as many miles as they drove in February 2020, the last month before the pandemic began to affect travel. February 2020 had one more day than February 2022, so if they both had the same number of days, February 2022 probably would have seen more miles driven than in February 2020.

Driving remains well ahead of other modes of travel while transit is furthest behind in its recovery from the pandemic.

The published numbers indicate that February driving in Delaware almost doubled from February 2020 levels, which may be due to an entry error. Otherwise, the largest increases in driving were in Louisiana (18%), Rhode Island (17%), Kentucky (16%), Arkansas, Hawaii, and South Carolina (all 13%), Florida and Indiana (both 12%), and Connecticut (11%). The largest decreases, relative to February 2020, were in Washington state (-21%), Kansas and North Dakota (both -18%), Minnesota (-17%), and Illinois (-12%).

Big City Populations Fell in 2021

The populations of many big cities declined in 2021 according to data recently released by the Census Bureau. The new data are for counties and metropolitan areas (which are simply the sums of various counties), and not necessarily for cities. But many cities, including Chicago, Portland, San Francisco, and Seattle, are closely identified with single counties, so those counties can be compared with surrounding counties to see what is going on.

People are leaving the cities.

I may cover this in more detail in a future policy brief, but for now I want to ask a single question: did people move out of cities in 2020 because of taxes and housing prices, as one article claims, or because of COVID? Continue reading

January Driving 7.8% below Pre-Pandemic Miles

Americans drove more than 240 billion vehicle-miles in January 2022, according to preliminary data released yesterday by the Federal Highway Administration. This was a 7.8 percent decrease from the nearly 261 billion vehicle-miles driving in January 2020. This was the first month in half a year that driving was less than the same month before the pandemic.

Driving thus follows the same pattern as other modes of travel, declining in January after several months of increases relative to before the pandemic. When compared with December, miles of driving fell by 10.4 percent, compared with 21.9 percent for air travel, 14.0 percent for transit, and 37.8 percent for Amtrak. These declines must have been due to concerns about the omicron variant of the coronavirus. Continue reading

January Travel Dips

Most modes of travel took a nosedive in January, whether measured on a month-to-month basis or compared with pre-pandemic travel. Amtrak passenger-miles fell from 404 million in December to 231 million in January. January travel is generally a little less than December’s, but in this case it is much less: as a percent of pre-pandemic numbers, Amtrak passenger-miles fell from 69 percent in December (relative to December 2019) to 56 percent in January (relative to January 2020), according to Amtrak’s Monthly Performance Report.

Transit is also lagging behind, according to data released earlier this week by the Federal Transit Administration. Transit carried 377 million riders in January, down from 438 million in December. As a share of pre-pandemic numbers, transit fell from 56 percent in December to 47 percent in January. Continue reading

December Driving 2.7% Above 2019

Americans drove 2.7 percent more miles in December 2021 than in December 2019, according to the latest traffic volume data published by the Federal Highway Administration last Friday. According to these data, December was the seventh month in a row that driving exceeded driving in the same month in 2019.

This is a revision from previous reports because the Federal Highway Administration revised the national miles-traveled for December 2019 (shown on page 2 of the report). The preliminary estimate in 2019 was that Americans drove 273.8 billion vehicle miles in December. In 2020, this was revised downwards to 272.2 billion. But this report, for 2021, revised the December 2019 miles downwards even more to 261.8 billion. Continue reading